Vietnamese vs Immigrants from Vietnam 10th Grade
COMPARE
Vietnamese
Immigrants from Vietnam
10th Grade
10th Grade Comparison
Vietnamese
Immigrants from Vietnam
90.9%
10TH GRADE
0.0/ 100
METRIC RATING
310th/ 347
METRIC RANK
91.2%
10TH GRADE
0.0/ 100
METRIC RATING
303rd/ 347
METRIC RANK
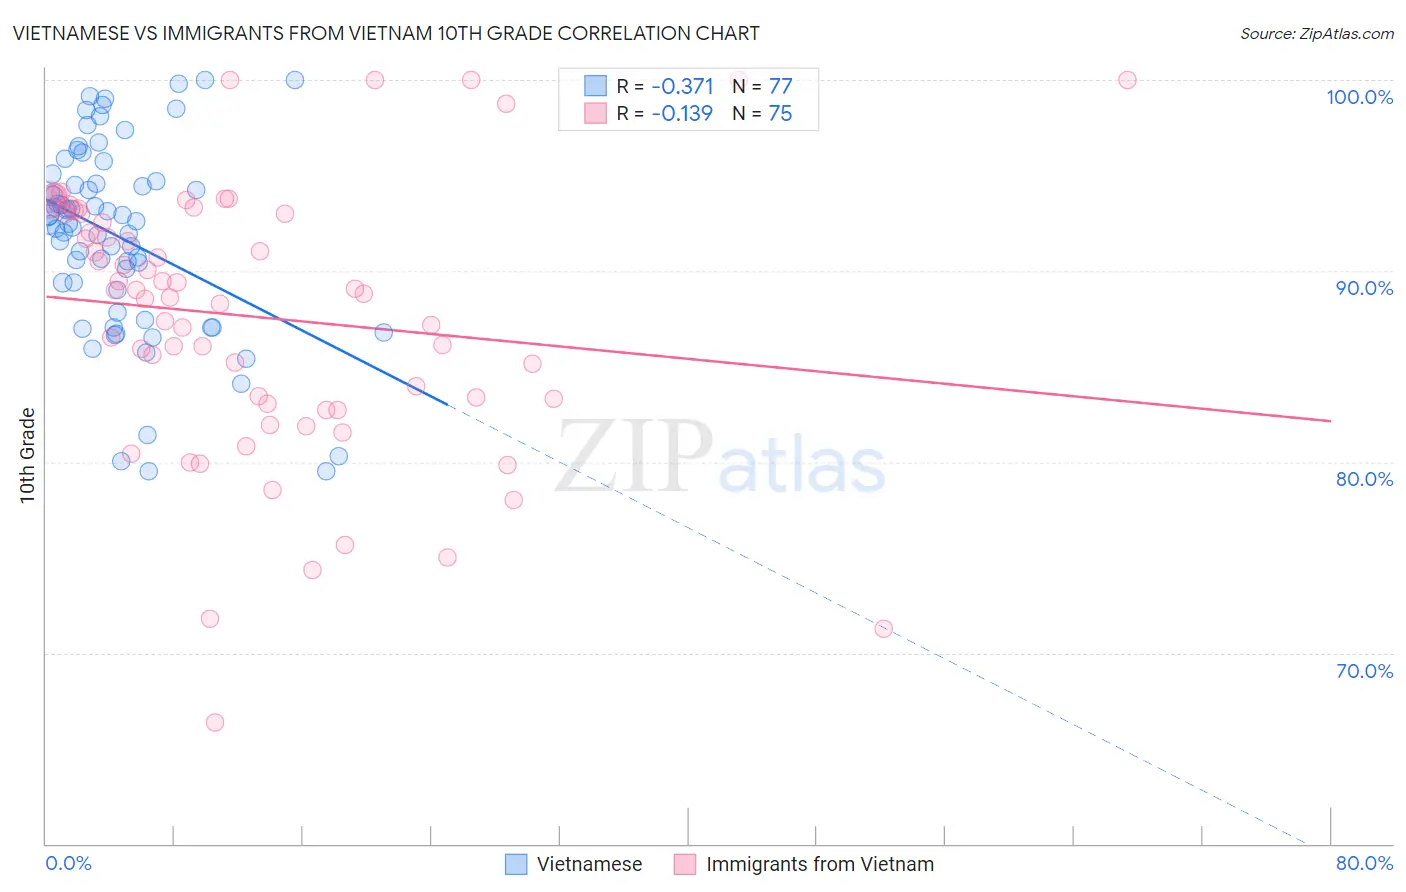
Vietnamese vs Immigrants from Vietnam 10th Grade Correlation Chart
The statistical analysis conducted on geographies consisting of 170,728,240 people shows a mild negative correlation between the proportion of Vietnamese and percentage of population with at least 10th grade education in the United States with a correlation coefficient (R) of -0.371 and weighted average of 90.9%. Similarly, the statistical analysis conducted on geographies consisting of 404,843,921 people shows a poor negative correlation between the proportion of Immigrants from Vietnam and percentage of population with at least 10th grade education in the United States with a correlation coefficient (R) of -0.139 and weighted average of 91.2%, a difference of 0.28%.
10th Grade Correlation Summary
| Measurement | Vietnamese | Immigrants from Vietnam |
| Minimum | 79.5% | 66.3% |
| Maximum | 100.0% | 100.0% |
| Range | 20.5% | 33.7% |
| Mean | 91.8% | 87.6% |
| Median | 92.5% | 88.8% |
| Interquartile 25% (IQ1) | 88.4% | 83.1% |
| Interquartile 75% (IQ3) | 94.6% | 93.0% |
| Interquartile Range (IQR) | 6.2% | 10.0% |
| Standard Deviation (Sample) | 5.0% | 7.1% |
| Standard Deviation (Population) | 4.9% | 7.0% |
Demographics Similar to Vietnamese and Immigrants from Vietnam by 10th Grade
In terms of 10th grade, the demographic groups most similar to Vietnamese are Immigrants from Cambodia (90.9%, a difference of 0.020%), Immigrants (91.0%, a difference of 0.040%), Immigrants from Bangladesh (91.0%, a difference of 0.080%), Immigrants from Fiji (91.0%, a difference of 0.090%), and Yaqui (91.1%, a difference of 0.15%). Similarly, the demographic groups most similar to Immigrants from Vietnam are Immigrants from Guyana (91.2%, a difference of 0.020%), Japanese (91.2%, a difference of 0.030%), Pima (91.2%, a difference of 0.060%), Immigrants from Dominica (91.1%, a difference of 0.070%), and Yaqui (91.1%, a difference of 0.13%).
| Demographics | Rating | Rank | 10th Grade |
| Immigrants | Grenada | 0.0 /100 | #296 | Tragic 91.6% |
| Fijians | 0.0 /100 | #297 | Tragic 91.5% |
| Cubans | 0.0 /100 | #298 | Tragic 91.5% |
| Immigrants | Haiti | 0.0 /100 | #299 | Tragic 91.4% |
| Guyanese | 0.0 /100 | #300 | Tragic 91.4% |
| Japanese | 0.0 /100 | #301 | Tragic 91.2% |
| Immigrants | Guyana | 0.0 /100 | #302 | Tragic 91.2% |
| Immigrants | Vietnam | 0.0 /100 | #303 | Tragic 91.2% |
| Pima | 0.0 /100 | #304 | Tragic 91.2% |
| Immigrants | Dominica | 0.0 /100 | #305 | Tragic 91.1% |
| Yaqui | 0.0 /100 | #306 | Tragic 91.1% |
| Immigrants | Fiji | 0.0 /100 | #307 | Tragic 91.0% |
| Immigrants | Bangladesh | 0.0 /100 | #308 | Tragic 91.0% |
| Immigrants | Immigrants | 0.0 /100 | #309 | Tragic 91.0% |
| Vietnamese | 0.0 /100 | #310 | Tragic 90.9% |
| Immigrants | Cambodia | 0.0 /100 | #311 | Tragic 90.9% |
| Immigrants | Portugal | 0.0 /100 | #312 | Tragic 90.8% |
| Cape Verdeans | 0.0 /100 | #313 | Tragic 90.8% |
| Nepalese | 0.0 /100 | #314 | Tragic 90.7% |
| Immigrants | Caribbean | 0.0 /100 | #315 | Tragic 90.6% |
| Ecuadorians | 0.0 /100 | #316 | Tragic 90.6% |