Vietnamese vs Czech 10th Grade
COMPARE
Vietnamese
Czech
10th Grade
10th Grade Comparison
Vietnamese
Czechs
90.9%
10TH GRADE
0.0/ 100
METRIC RATING
310th/ 347
METRIC RANK
95.5%
10TH GRADE
100.0/ 100
METRIC RATING
23rd/ 347
METRIC RANK
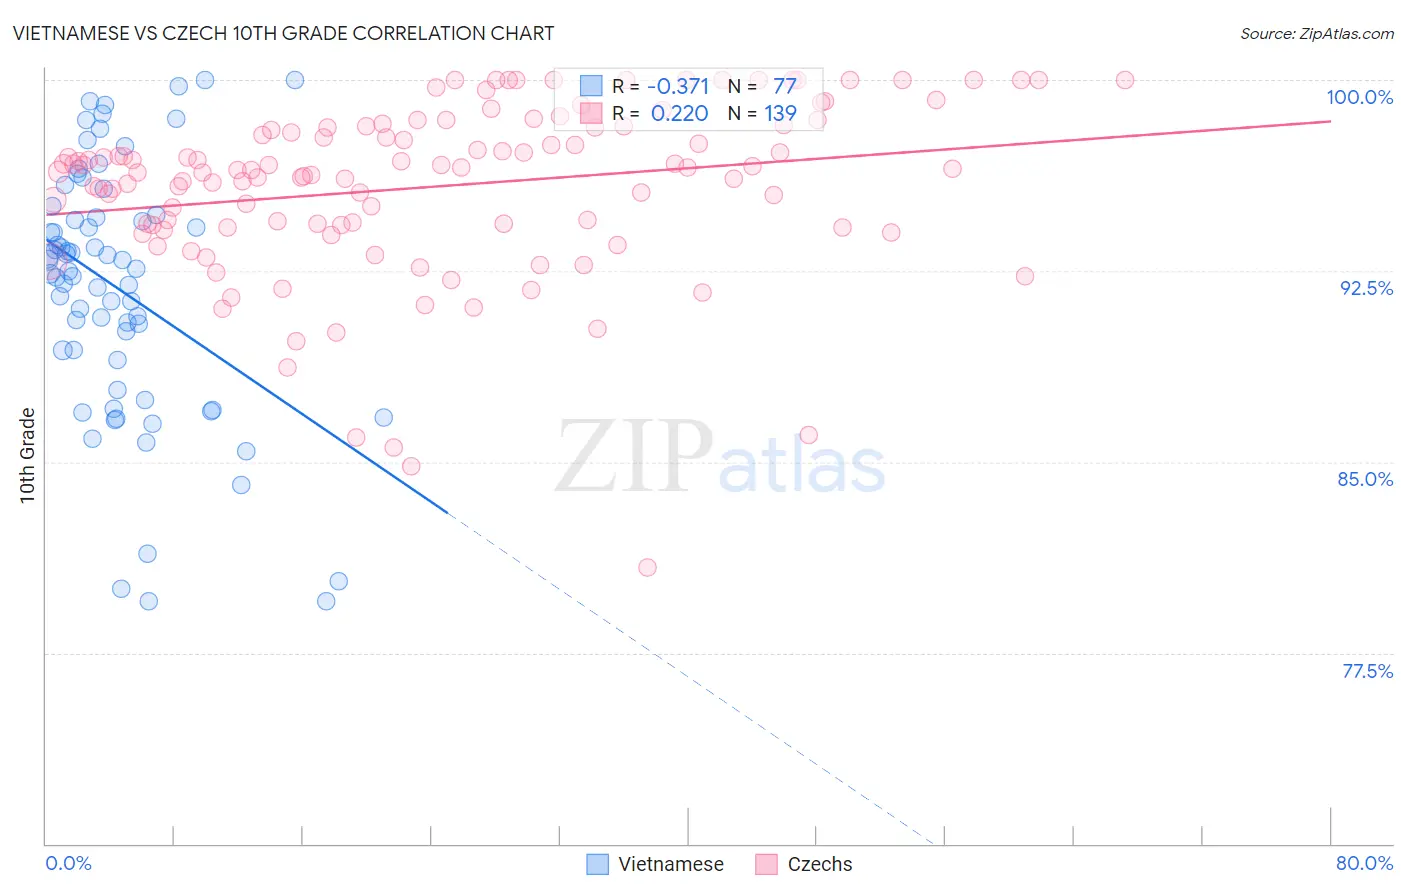
Vietnamese vs Czech 10th Grade Correlation Chart
The statistical analysis conducted on geographies consisting of 170,728,240 people shows a mild negative correlation between the proportion of Vietnamese and percentage of population with at least 10th grade education in the United States with a correlation coefficient (R) of -0.371 and weighted average of 90.9%. Similarly, the statistical analysis conducted on geographies consisting of 484,813,928 people shows a weak positive correlation between the proportion of Czechs and percentage of population with at least 10th grade education in the United States with a correlation coefficient (R) of 0.220 and weighted average of 95.5%, a difference of 5.0%.
10th Grade Correlation Summary
| Measurement | Vietnamese | Czech |
| Minimum | 79.5% | 80.9% |
| Maximum | 100.0% | 100.0% |
| Range | 20.5% | 19.1% |
| Mean | 91.8% | 95.8% |
| Median | 92.5% | 96.5% |
| Interquartile 25% (IQ1) | 88.4% | 94.3% |
| Interquartile 75% (IQ3) | 94.6% | 98.1% |
| Interquartile Range (IQR) | 6.2% | 3.9% |
| Standard Deviation (Sample) | 5.0% | 3.4% |
| Standard Deviation (Population) | 4.9% | 3.4% |
Similar Demographics by 10th Grade
Demographics Similar to Vietnamese by 10th Grade
In terms of 10th grade, the demographic groups most similar to Vietnamese are Immigrants from Cambodia (90.9%, a difference of 0.020%), Immigrants (91.0%, a difference of 0.040%), Immigrants from Bangladesh (91.0%, a difference of 0.080%), Immigrants from Fiji (91.0%, a difference of 0.090%), and Yaqui (91.1%, a difference of 0.15%).
| Demographics | Rating | Rank | 10th Grade |
| Immigrants | Vietnam | 0.0 /100 | #303 | Tragic 91.2% |
| Pima | 0.0 /100 | #304 | Tragic 91.2% |
| Immigrants | Dominica | 0.0 /100 | #305 | Tragic 91.1% |
| Yaqui | 0.0 /100 | #306 | Tragic 91.1% |
| Immigrants | Fiji | 0.0 /100 | #307 | Tragic 91.0% |
| Immigrants | Bangladesh | 0.0 /100 | #308 | Tragic 91.0% |
| Immigrants | Immigrants | 0.0 /100 | #309 | Tragic 91.0% |
| Vietnamese | 0.0 /100 | #310 | Tragic 90.9% |
| Immigrants | Cambodia | 0.0 /100 | #311 | Tragic 90.9% |
| Immigrants | Portugal | 0.0 /100 | #312 | Tragic 90.8% |
| Cape Verdeans | 0.0 /100 | #313 | Tragic 90.8% |
| Nepalese | 0.0 /100 | #314 | Tragic 90.7% |
| Immigrants | Caribbean | 0.0 /100 | #315 | Tragic 90.6% |
| Ecuadorians | 0.0 /100 | #316 | Tragic 90.6% |
| Immigrants | Ecuador | 0.0 /100 | #317 | Tragic 90.4% |
Demographics Similar to Czechs by 10th Grade
In terms of 10th grade, the demographic groups most similar to Czechs are Eastern European (95.5%, a difference of 0.010%), European (95.5%, a difference of 0.010%), Maltese (95.5%, a difference of 0.020%), Welsh (95.5%, a difference of 0.030%), and Dutch (95.5%, a difference of 0.050%).
| Demographics | Rating | Rank | 10th Grade |
| Scottish | 100.0 /100 | #16 | Exceptional 95.6% |
| Latvians | 100.0 /100 | #17 | Exceptional 95.6% |
| Italians | 100.0 /100 | #18 | Exceptional 95.6% |
| Scandinavians | 100.0 /100 | #19 | Exceptional 95.6% |
| Chinese | 100.0 /100 | #20 | Exceptional 95.5% |
| Dutch | 100.0 /100 | #21 | Exceptional 95.5% |
| Eastern Europeans | 100.0 /100 | #22 | Exceptional 95.5% |
| Czechs | 100.0 /100 | #23 | Exceptional 95.5% |
| Europeans | 100.0 /100 | #24 | Exceptional 95.5% |
| Maltese | 100.0 /100 | #25 | Exceptional 95.5% |
| Welsh | 100.0 /100 | #26 | Exceptional 95.5% |
| Alaskan Athabascans | 100.0 /100 | #27 | Exceptional 95.4% |
| Luxembourgers | 100.0 /100 | #28 | Exceptional 95.4% |
| Bulgarians | 100.0 /100 | #29 | Exceptional 95.4% |
| Belgians | 100.0 /100 | #30 | Exceptional 95.4% |