Japanese vs Immigrants from Honduras 10th Grade
COMPARE
Japanese
Immigrants from Honduras
10th Grade
10th Grade Comparison
Japanese
Immigrants from Honduras
91.2%
10TH GRADE
0.0/ 100
METRIC RATING
301st/ 347
METRIC RANK
88.5%
10TH GRADE
0.0/ 100
METRIC RATING
336th/ 347
METRIC RANK
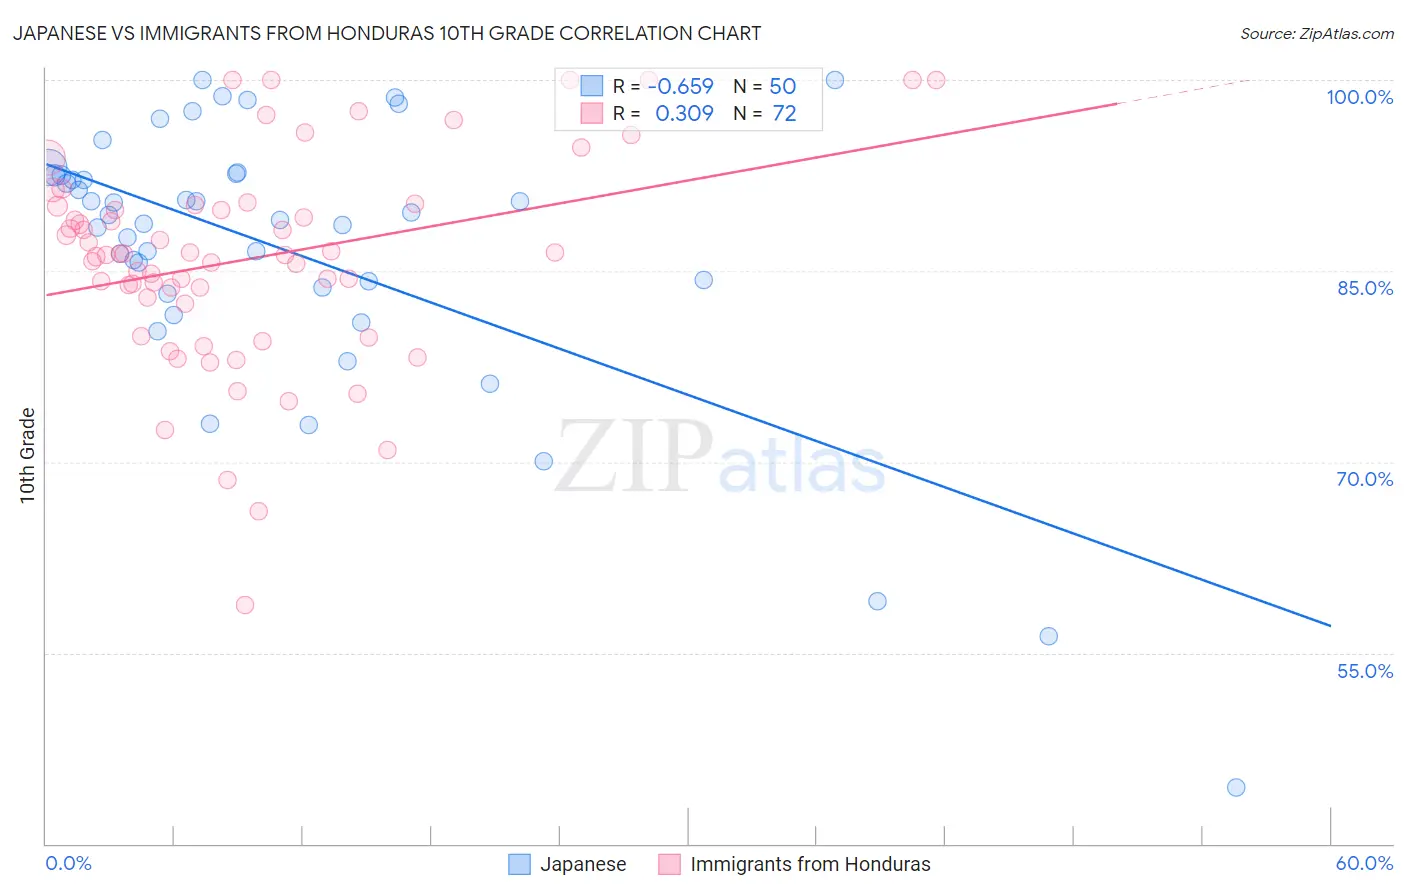
Japanese vs Immigrants from Honduras 10th Grade Correlation Chart
The statistical analysis conducted on geographies consisting of 249,183,224 people shows a significant negative correlation between the proportion of Japanese and percentage of population with at least 10th grade education in the United States with a correlation coefficient (R) of -0.659 and weighted average of 91.2%. Similarly, the statistical analysis conducted on geographies consisting of 322,637,445 people shows a mild positive correlation between the proportion of Immigrants from Honduras and percentage of population with at least 10th grade education in the United States with a correlation coefficient (R) of 0.309 and weighted average of 88.5%, a difference of 3.0%.
10th Grade Correlation Summary
| Measurement | Japanese | Immigrants from Honduras |
| Minimum | 44.4% | 58.7% |
| Maximum | 100.0% | 100.0% |
| Range | 55.6% | 41.3% |
| Mean | 86.5% | 86.0% |
| Median | 89.2% | 86.3% |
| Interquartile 25% (IQ1) | 83.7% | 82.7% |
| Interquartile 75% (IQ3) | 92.6% | 90.2% |
| Interquartile Range (IQR) | 8.9% | 7.5% |
| Standard Deviation (Sample) | 11.1% | 8.2% |
| Standard Deviation (Population) | 11.0% | 8.2% |
Similar Demographics by 10th Grade
Demographics Similar to Japanese by 10th Grade
In terms of 10th grade, the demographic groups most similar to Japanese are Immigrants from Guyana (91.2%, a difference of 0.010%), Immigrants from Vietnam (91.2%, a difference of 0.030%), Pima (91.2%, a difference of 0.080%), Immigrants from Dominica (91.1%, a difference of 0.10%), and Guyanese (91.4%, a difference of 0.15%).
| Demographics | Rating | Rank | 10th Grade |
| Haitians | 0.0 /100 | #294 | Tragic 91.8% |
| Lumbee | 0.0 /100 | #295 | Tragic 91.7% |
| Immigrants | Grenada | 0.0 /100 | #296 | Tragic 91.6% |
| Fijians | 0.0 /100 | #297 | Tragic 91.5% |
| Cubans | 0.0 /100 | #298 | Tragic 91.5% |
| Immigrants | Haiti | 0.0 /100 | #299 | Tragic 91.4% |
| Guyanese | 0.0 /100 | #300 | Tragic 91.4% |
| Japanese | 0.0 /100 | #301 | Tragic 91.2% |
| Immigrants | Guyana | 0.0 /100 | #302 | Tragic 91.2% |
| Immigrants | Vietnam | 0.0 /100 | #303 | Tragic 91.2% |
| Pima | 0.0 /100 | #304 | Tragic 91.2% |
| Immigrants | Dominica | 0.0 /100 | #305 | Tragic 91.1% |
| Yaqui | 0.0 /100 | #306 | Tragic 91.1% |
| Immigrants | Fiji | 0.0 /100 | #307 | Tragic 91.0% |
| Immigrants | Bangladesh | 0.0 /100 | #308 | Tragic 91.0% |
Demographics Similar to Immigrants from Honduras by 10th Grade
In terms of 10th grade, the demographic groups most similar to Immigrants from Honduras are Central American (88.4%, a difference of 0.15%), Immigrants from Dominican Republic (88.7%, a difference of 0.19%), Immigrants from Latin America (88.3%, a difference of 0.21%), Hispanic or Latino (88.9%, a difference of 0.37%), and Honduran (89.0%, a difference of 0.49%).
| Demographics | Rating | Rank | 10th Grade |
| Dominicans | 0.0 /100 | #329 | Tragic 89.4% |
| Immigrants | Yemen | 0.0 /100 | #330 | Tragic 89.1% |
| Mexican American Indians | 0.0 /100 | #331 | Tragic 89.0% |
| Immigrants | Azores | 0.0 /100 | #332 | Tragic 89.0% |
| Hondurans | 0.0 /100 | #333 | Tragic 89.0% |
| Hispanics or Latinos | 0.0 /100 | #334 | Tragic 88.9% |
| Immigrants | Dominican Republic | 0.0 /100 | #335 | Tragic 88.7% |
| Immigrants | Honduras | 0.0 /100 | #336 | Tragic 88.5% |
| Central Americans | 0.0 /100 | #337 | Tragic 88.4% |
| Immigrants | Latin America | 0.0 /100 | #338 | Tragic 88.3% |
| Guatemalans | 0.0 /100 | #339 | Tragic 87.9% |
| Mexicans | 0.0 /100 | #340 | Tragic 87.8% |
| Salvadorans | 0.0 /100 | #341 | Tragic 87.5% |
| Immigrants | Guatemala | 0.0 /100 | #342 | Tragic 87.4% |
| Yakama | 0.0 /100 | #343 | Tragic 86.9% |