Canadian vs Immigrants from Honduras 10th Grade
COMPARE
Canadian
Immigrants from Honduras
10th Grade
10th Grade Comparison
Canadians
Immigrants from Honduras
94.9%
10TH GRADE
99.6/ 100
METRIC RATING
74th/ 347
METRIC RANK
88.5%
10TH GRADE
0.0/ 100
METRIC RATING
336th/ 347
METRIC RANK
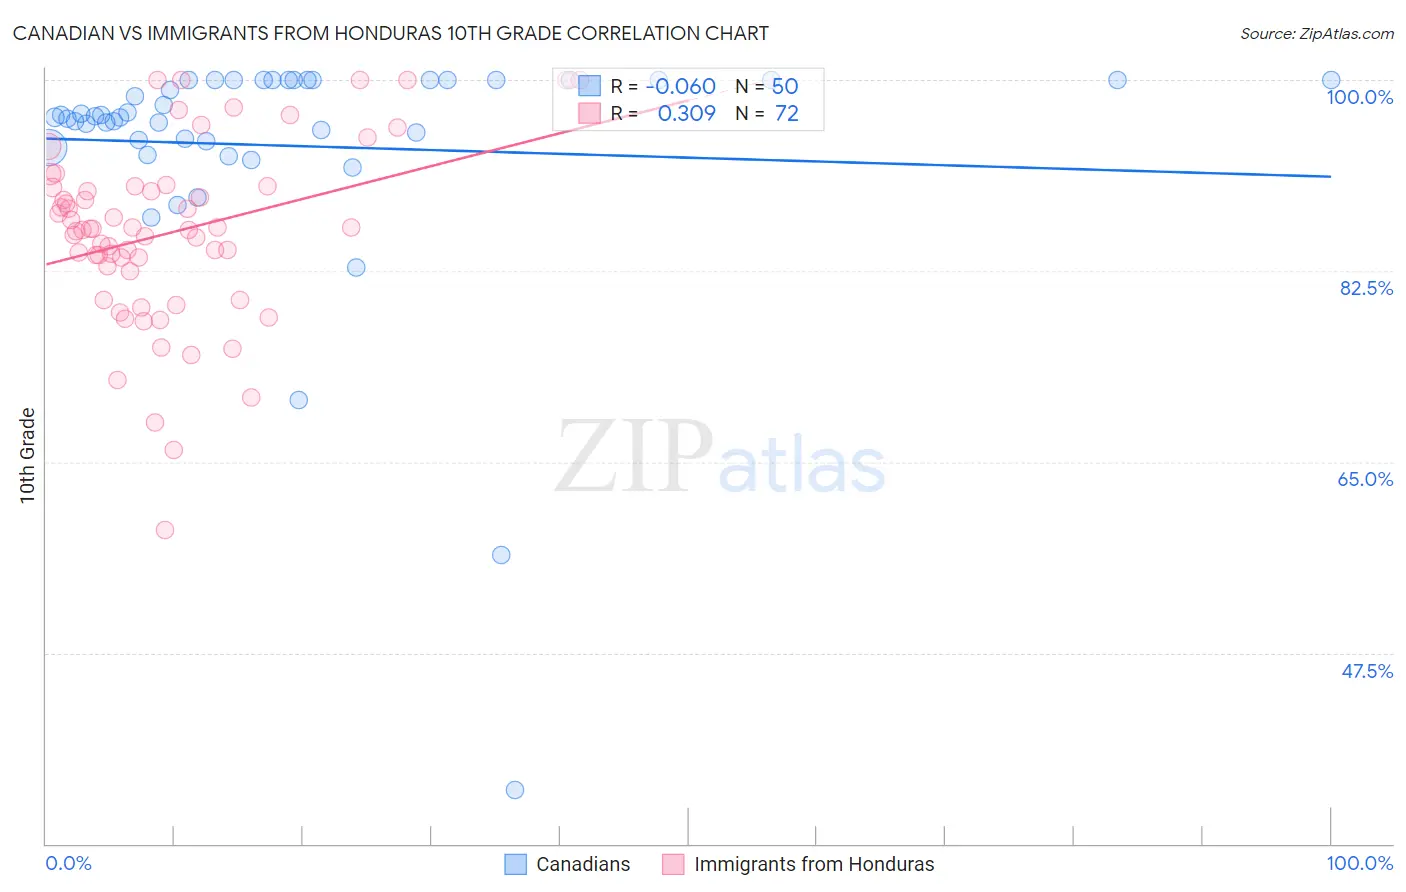
Canadian vs Immigrants from Honduras 10th Grade Correlation Chart
The statistical analysis conducted on geographies consisting of 437,556,598 people shows a slight negative correlation between the proportion of Canadians and percentage of population with at least 10th grade education in the United States with a correlation coefficient (R) of -0.060 and weighted average of 94.9%. Similarly, the statistical analysis conducted on geographies consisting of 322,637,445 people shows a mild positive correlation between the proportion of Immigrants from Honduras and percentage of population with at least 10th grade education in the United States with a correlation coefficient (R) of 0.309 and weighted average of 88.5%, a difference of 7.2%.
10th Grade Correlation Summary
| Measurement | Canadian | Immigrants from Honduras |
| Minimum | 34.9% | 58.7% |
| Maximum | 100.0% | 100.0% |
| Range | 65.1% | 41.3% |
| Mean | 94.0% | 86.0% |
| Median | 96.6% | 86.3% |
| Interquartile 25% (IQ1) | 94.4% | 82.7% |
| Interquartile 75% (IQ3) | 100.0% | 90.2% |
| Interquartile Range (IQR) | 5.6% | 7.5% |
| Standard Deviation (Sample) | 11.5% | 8.2% |
| Standard Deviation (Population) | 11.3% | 8.2% |
Similar Demographics by 10th Grade
Demographics Similar to Canadians by 10th Grade
In terms of 10th grade, the demographic groups most similar to Canadians are Bhutanese (94.9%, a difference of 0.0%), Immigrants from Sweden (94.9%, a difference of 0.010%), Alaska Native (94.9%, a difference of 0.020%), Zimbabwean (94.9%, a difference of 0.030%), and Okinawan (94.8%, a difference of 0.030%).
| Demographics | Rating | Rank | 10th Grade |
| Immigrants | Netherlands | 99.7 /100 | #67 | Exceptional 94.9% |
| Immigrants | Belgium | 99.7 /100 | #68 | Exceptional 94.9% |
| Immigrants | England | 99.6 /100 | #69 | Exceptional 94.9% |
| Zimbabweans | 99.6 /100 | #70 | Exceptional 94.9% |
| Alaska Natives | 99.6 /100 | #71 | Exceptional 94.9% |
| Immigrants | Sweden | 99.6 /100 | #72 | Exceptional 94.9% |
| Bhutanese | 99.6 /100 | #73 | Exceptional 94.9% |
| Canadians | 99.6 /100 | #74 | Exceptional 94.9% |
| Okinawans | 99.5 /100 | #75 | Exceptional 94.8% |
| Romanians | 99.5 /100 | #76 | Exceptional 94.8% |
| Immigrants | South Africa | 99.5 /100 | #77 | Exceptional 94.8% |
| Filipinos | 99.3 /100 | #78 | Exceptional 94.8% |
| Immigrants | Czechoslovakia | 99.2 /100 | #79 | Exceptional 94.7% |
| Immigrants | Denmark | 99.2 /100 | #80 | Exceptional 94.7% |
| Immigrants | Latvia | 99.2 /100 | #81 | Exceptional 94.7% |
Demographics Similar to Immigrants from Honduras by 10th Grade
In terms of 10th grade, the demographic groups most similar to Immigrants from Honduras are Central American (88.4%, a difference of 0.15%), Immigrants from Dominican Republic (88.7%, a difference of 0.19%), Immigrants from Latin America (88.3%, a difference of 0.21%), Hispanic or Latino (88.9%, a difference of 0.37%), and Honduran (89.0%, a difference of 0.49%).
| Demographics | Rating | Rank | 10th Grade |
| Dominicans | 0.0 /100 | #329 | Tragic 89.4% |
| Immigrants | Yemen | 0.0 /100 | #330 | Tragic 89.1% |
| Mexican American Indians | 0.0 /100 | #331 | Tragic 89.0% |
| Immigrants | Azores | 0.0 /100 | #332 | Tragic 89.0% |
| Hondurans | 0.0 /100 | #333 | Tragic 89.0% |
| Hispanics or Latinos | 0.0 /100 | #334 | Tragic 88.9% |
| Immigrants | Dominican Republic | 0.0 /100 | #335 | Tragic 88.7% |
| Immigrants | Honduras | 0.0 /100 | #336 | Tragic 88.5% |
| Central Americans | 0.0 /100 | #337 | Tragic 88.4% |
| Immigrants | Latin America | 0.0 /100 | #338 | Tragic 88.3% |
| Guatemalans | 0.0 /100 | #339 | Tragic 87.9% |
| Mexicans | 0.0 /100 | #340 | Tragic 87.8% |
| Salvadorans | 0.0 /100 | #341 | Tragic 87.5% |
| Immigrants | Guatemala | 0.0 /100 | #342 | Tragic 87.4% |
| Yakama | 0.0 /100 | #343 | Tragic 86.9% |