Laotian vs Nonimmigrants College, Under 1 year
COMPARE
Laotian
Nonimmigrants
College, Under 1 year
College, Under 1 year Comparison
Laotians
Nonimmigrants
68.5%
COLLEGE, UNDER 1 YEAR
98.6/ 100
METRIC RATING
76th/ 347
METRIC RANK
62.9%
COLLEGE, UNDER 1 YEAR
3.0/ 100
METRIC RATING
230th/ 347
METRIC RANK
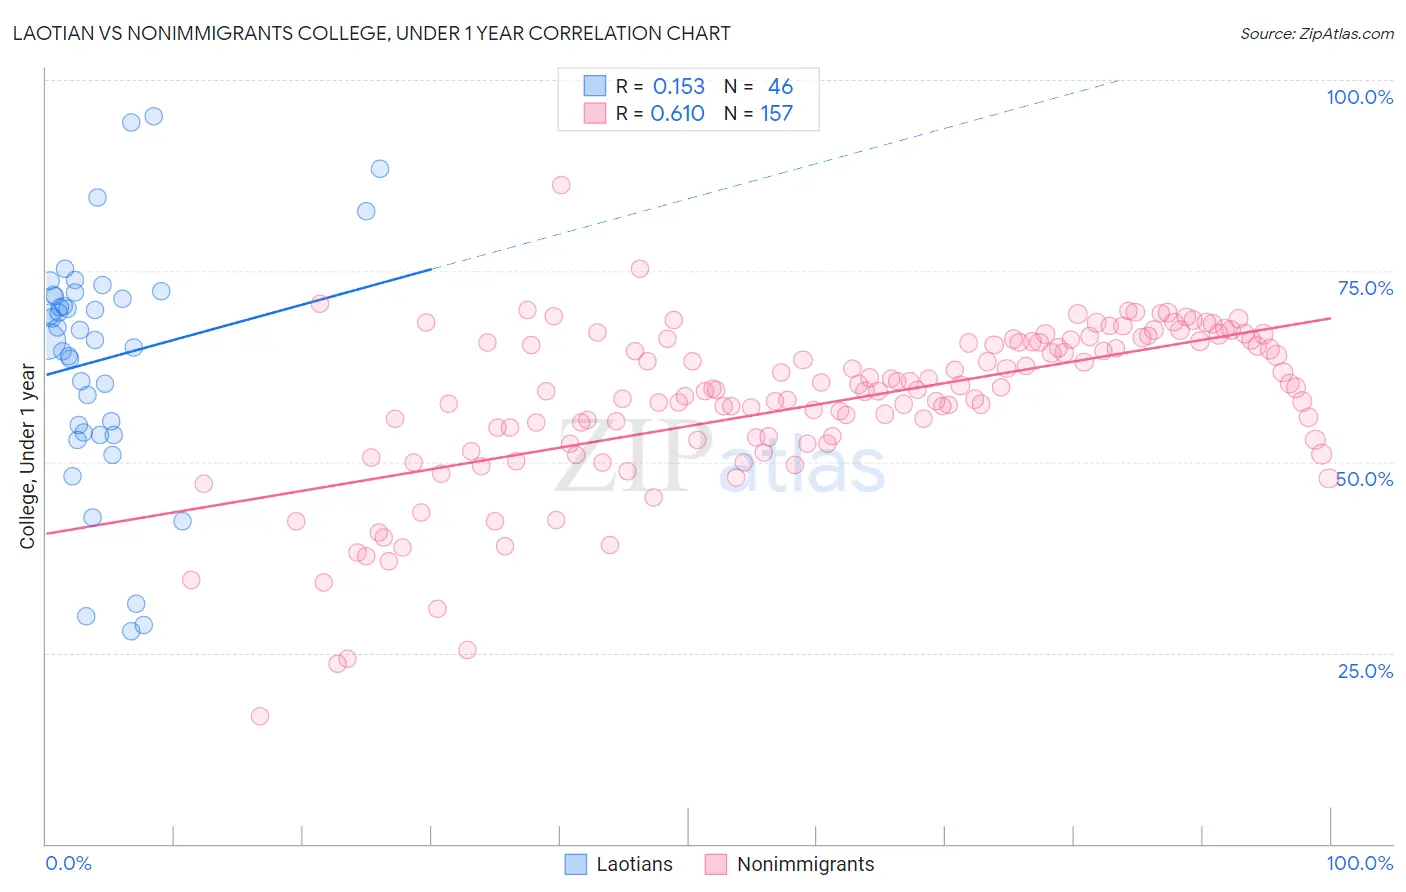
Laotian vs Nonimmigrants College, Under 1 year Correlation Chart
The statistical analysis conducted on geographies consisting of 224,861,279 people shows a poor positive correlation between the proportion of Laotians and percentage of population with at least college, under 1 year education in the United States with a correlation coefficient (R) of 0.153 and weighted average of 68.5%. Similarly, the statistical analysis conducted on geographies consisting of 585,317,870 people shows a significant positive correlation between the proportion of Nonimmigrants and percentage of population with at least college, under 1 year education in the United States with a correlation coefficient (R) of 0.610 and weighted average of 62.9%, a difference of 8.9%.
College, Under 1 year Correlation Summary
| Measurement | Laotian | Nonimmigrants |
| Minimum | 27.8% | 16.7% |
| Maximum | 95.2% | 86.3% |
| Range | 67.5% | 69.6% |
| Mean | 63.4% | 57.6% |
| Median | 66.6% | 59.4% |
| Interquartile 25% (IQ1) | 53.9% | 52.7% |
| Interquartile 75% (IQ3) | 71.9% | 65.7% |
| Interquartile Range (IQR) | 18.0% | 13.0% |
| Standard Deviation (Sample) | 15.7% | 10.8% |
| Standard Deviation (Population) | 15.5% | 10.8% |
Similar Demographics by College, Under 1 year
Demographics Similar to Laotians by College, Under 1 year
In terms of college, under 1 year, the demographic groups most similar to Laotians are Immigrants from Western Europe (68.5%, a difference of 0.0%), British (68.5%, a difference of 0.040%), Danish (68.5%, a difference of 0.050%), Greek (68.5%, a difference of 0.070%), and Immigrants from Spain (68.4%, a difference of 0.090%).
| Demographics | Rating | Rank | College, Under 1 year |
| Immigrants | Romania | 99.2 /100 | #69 | Exceptional 68.9% |
| Lithuanians | 99.1 /100 | #70 | Exceptional 68.8% |
| Immigrants | Europe | 99.1 /100 | #71 | Exceptional 68.8% |
| Bolivians | 99.0 /100 | #72 | Exceptional 68.7% |
| Immigrants | England | 99.0 /100 | #73 | Exceptional 68.7% |
| Swedes | 98.9 /100 | #74 | Exceptional 68.7% |
| Immigrants | Western Europe | 98.6 /100 | #75 | Exceptional 68.5% |
| Laotians | 98.6 /100 | #76 | Exceptional 68.5% |
| British | 98.6 /100 | #77 | Exceptional 68.5% |
| Danes | 98.6 /100 | #78 | Exceptional 68.5% |
| Greeks | 98.6 /100 | #79 | Exceptional 68.5% |
| Immigrants | Spain | 98.5 /100 | #80 | Exceptional 68.4% |
| Immigrants | Greece | 98.5 /100 | #81 | Exceptional 68.4% |
| Norwegians | 98.4 /100 | #82 | Exceptional 68.4% |
| Argentineans | 98.4 /100 | #83 | Exceptional 68.4% |
Demographics Similar to Nonimmigrants by College, Under 1 year
In terms of college, under 1 year, the demographic groups most similar to Nonimmigrants are Liberian (63.0%, a difference of 0.070%), Samoan (63.0%, a difference of 0.13%), Immigrants from Ghana (63.1%, a difference of 0.24%), Immigrants from Western Africa (62.8%, a difference of 0.24%), and Immigrants from Colombia (63.1%, a difference of 0.33%).
| Demographics | Rating | Rank | College, Under 1 year |
| Immigrants | Costa Rica | 4.5 /100 | #223 | Tragic 63.2% |
| Sub-Saharan Africans | 4.4 /100 | #224 | Tragic 63.2% |
| Immigrants | Peru | 4.0 /100 | #225 | Tragic 63.1% |
| Immigrants | Colombia | 4.0 /100 | #226 | Tragic 63.1% |
| Immigrants | Ghana | 3.7 /100 | #227 | Tragic 63.1% |
| Samoans | 3.3 /100 | #228 | Tragic 63.0% |
| Liberians | 3.2 /100 | #229 | Tragic 63.0% |
| Immigrants | Nonimmigrants | 3.0 /100 | #230 | Tragic 62.9% |
| Immigrants | Western Africa | 2.4 /100 | #231 | Tragic 62.8% |
| Osage | 2.2 /100 | #232 | Tragic 62.7% |
| Iroquois | 2.0 /100 | #233 | Tragic 62.6% |
| Chippewa | 2.0 /100 | #234 | Tragic 62.6% |
| Spanish Americans | 1.9 /100 | #235 | Tragic 62.6% |
| Immigrants | Immigrants | 1.7 /100 | #236 | Tragic 62.5% |
| Immigrants | Burma/Myanmar | 1.6 /100 | #237 | Tragic 62.5% |