Ute vs Samoan College, 1 year or more
COMPARE
Ute
Samoan
College, 1 year or more
College, 1 year or more Comparison
Ute
Samoans
53.8%
COLLEGE, 1 YEAR OR MORE
0.1/ 100
METRIC RATING
284th/ 347
METRIC RANK
56.2%
COLLEGE, 1 YEAR OR MORE
1.6/ 100
METRIC RATING
237th/ 347
METRIC RANK
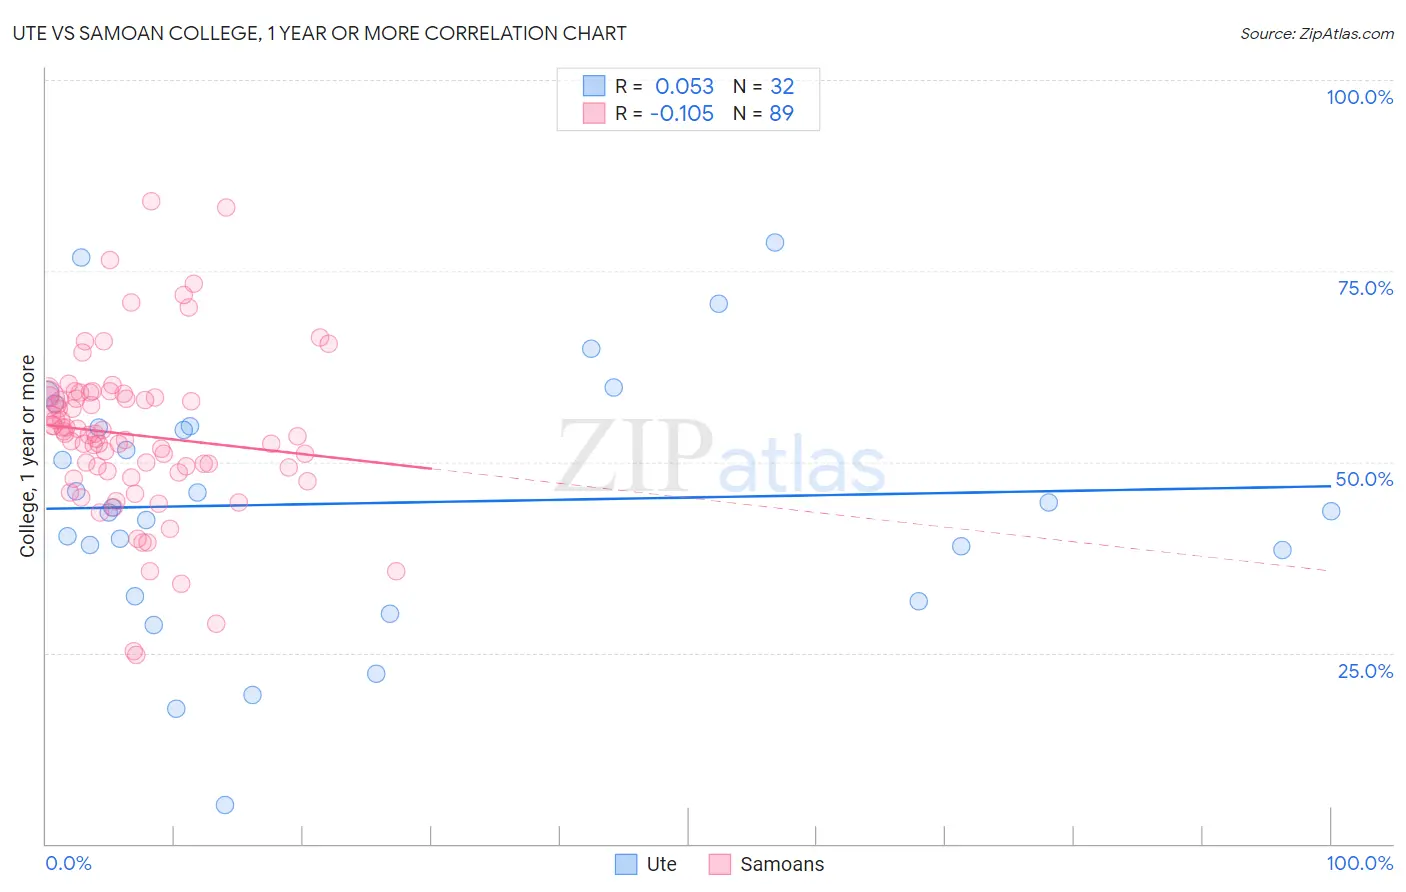
Ute vs Samoan College, 1 year or more Correlation Chart
The statistical analysis conducted on geographies consisting of 55,668,599 people shows a slight positive correlation between the proportion of Ute and percentage of population with at least college, 1 year or more education in the United States with a correlation coefficient (R) of 0.053 and weighted average of 53.8%. Similarly, the statistical analysis conducted on geographies consisting of 225,205,919 people shows a poor negative correlation between the proportion of Samoans and percentage of population with at least college, 1 year or more education in the United States with a correlation coefficient (R) of -0.105 and weighted average of 56.2%, a difference of 4.4%.
College, 1 year or more Correlation Summary
| Measurement | Ute | Samoan |
| Minimum | 5.1% | 24.6% |
| Maximum | 78.7% | 84.1% |
| Range | 73.6% | 59.5% |
| Mean | 44.6% | 53.6% |
| Median | 43.8% | 53.6% |
| Interquartile 25% (IQ1) | 35.4% | 48.7% |
| Interquartile 75% (IQ3) | 54.6% | 58.5% |
| Interquartile Range (IQR) | 19.2% | 9.8% |
| Standard Deviation (Sample) | 16.7% | 10.6% |
| Standard Deviation (Population) | 16.4% | 10.5% |
Similar Demographics by College, 1 year or more
Demographics Similar to Ute by College, 1 year or more
In terms of college, 1 year or more, the demographic groups most similar to Ute are Nicaraguan (53.9%, a difference of 0.17%), Immigrants from Guyana (53.5%, a difference of 0.46%), Central American Indian (53.5%, a difference of 0.51%), Guyanese (54.1%, a difference of 0.53%), and Immigrants from Belize (53.5%, a difference of 0.54%).
| Demographics | Rating | Rank | College, 1 year or more |
| Ecuadorians | 0.2 /100 | #277 | Tragic 54.3% |
| Immigrants | Jamaica | 0.1 /100 | #278 | Tragic 54.2% |
| Arapaho | 0.1 /100 | #279 | Tragic 54.1% |
| Cheyenne | 0.1 /100 | #280 | Tragic 54.1% |
| Colville | 0.1 /100 | #281 | Tragic 54.1% |
| Guyanese | 0.1 /100 | #282 | Tragic 54.1% |
| Nicaraguans | 0.1 /100 | #283 | Tragic 53.9% |
| Ute | 0.1 /100 | #284 | Tragic 53.8% |
| Immigrants | Guyana | 0.1 /100 | #285 | Tragic 53.5% |
| Central American Indians | 0.1 /100 | #286 | Tragic 53.5% |
| Immigrants | Belize | 0.1 /100 | #287 | Tragic 53.5% |
| Alaska Natives | 0.0 /100 | #288 | Tragic 53.4% |
| Immigrants | Ecuador | 0.0 /100 | #289 | Tragic 53.4% |
| Alaskan Athabascans | 0.0 /100 | #290 | Tragic 53.4% |
| Cubans | 0.0 /100 | #291 | Tragic 53.4% |
Demographics Similar to Samoans by College, 1 year or more
In terms of college, 1 year or more, the demographic groups most similar to Samoans are Iroquois (56.2%, a difference of 0.11%), Spanish American (56.3%, a difference of 0.16%), West Indian (56.3%, a difference of 0.16%), Barbadian (56.0%, a difference of 0.27%), and Puget Sound Salish (55.9%, a difference of 0.47%).
| Demographics | Rating | Rank | College, 1 year or more |
| Liberians | 3.1 /100 | #230 | Tragic 56.7% |
| Immigrants | Burma/Myanmar | 2.7 /100 | #231 | Tragic 56.6% |
| Immigrants | Bangladesh | 2.6 /100 | #232 | Tragic 56.6% |
| Immigrants | Nonimmigrants | 2.5 /100 | #233 | Tragic 56.5% |
| Spanish Americans | 1.8 /100 | #234 | Tragic 56.3% |
| West Indians | 1.8 /100 | #235 | Tragic 56.3% |
| Iroquois | 1.7 /100 | #236 | Tragic 56.2% |
| Samoans | 1.6 /100 | #237 | Tragic 56.2% |
| Barbadians | 1.3 /100 | #238 | Tragic 56.0% |
| Puget Sound Salish | 1.1 /100 | #239 | Tragic 55.9% |
| Trinidadians and Tobagonians | 1.1 /100 | #240 | Tragic 55.8% |
| French American Indians | 1.0 /100 | #241 | Tragic 55.8% |
| Marshallese | 1.0 /100 | #242 | Tragic 55.8% |
| Osage | 1.0 /100 | #243 | Tragic 55.8% |
| Chippewa | 0.9 /100 | #244 | Tragic 55.7% |