Ute vs Immigrants from Canada College, 1 year or more
COMPARE
Ute
Immigrants from Canada
College, 1 year or more
College, 1 year or more Comparison
Ute
Immigrants from Canada
53.8%
COLLEGE, 1 YEAR OR MORE
0.1/ 100
METRIC RATING
284th/ 347
METRIC RANK
63.1%
COLLEGE, 1 YEAR OR MORE
99.1/ 100
METRIC RATING
71st/ 347
METRIC RANK
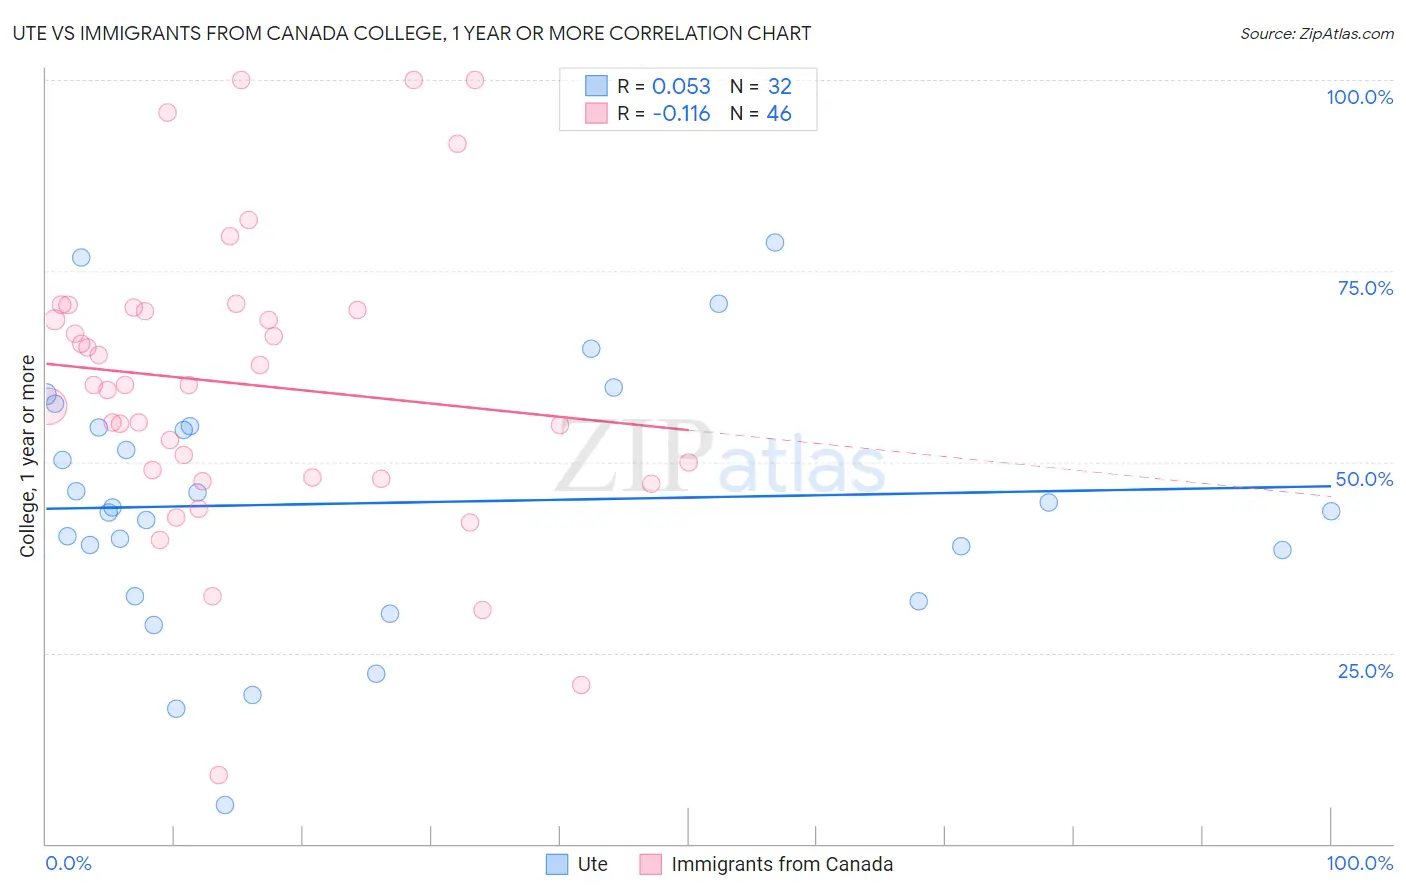
Ute vs Immigrants from Canada College, 1 year or more Correlation Chart
The statistical analysis conducted on geographies consisting of 55,668,599 people shows a slight positive correlation between the proportion of Ute and percentage of population with at least college, 1 year or more education in the United States with a correlation coefficient (R) of 0.053 and weighted average of 53.8%. Similarly, the statistical analysis conducted on geographies consisting of 459,391,400 people shows a poor negative correlation between the proportion of Immigrants from Canada and percentage of population with at least college, 1 year or more education in the United States with a correlation coefficient (R) of -0.116 and weighted average of 63.1%, a difference of 17.3%.
College, 1 year or more Correlation Summary
| Measurement | Ute | Immigrants from Canada |
| Minimum | 5.1% | 9.0% |
| Maximum | 78.7% | 100.0% |
| Range | 73.6% | 91.0% |
| Mean | 44.6% | 60.2% |
| Median | 43.8% | 60.0% |
| Interquartile 25% (IQ1) | 35.4% | 47.9% |
| Interquartile 75% (IQ3) | 54.6% | 69.9% |
| Interquartile Range (IQR) | 19.2% | 22.0% |
| Standard Deviation (Sample) | 16.7% | 19.5% |
| Standard Deviation (Population) | 16.4% | 19.2% |
Similar Demographics by College, 1 year or more
Demographics Similar to Ute by College, 1 year or more
In terms of college, 1 year or more, the demographic groups most similar to Ute are Nicaraguan (53.9%, a difference of 0.17%), Immigrants from Guyana (53.5%, a difference of 0.46%), Central American Indian (53.5%, a difference of 0.51%), Guyanese (54.1%, a difference of 0.53%), and Immigrants from Belize (53.5%, a difference of 0.54%).
| Demographics | Rating | Rank | College, 1 year or more |
| Ecuadorians | 0.2 /100 | #277 | Tragic 54.3% |
| Immigrants | Jamaica | 0.1 /100 | #278 | Tragic 54.2% |
| Arapaho | 0.1 /100 | #279 | Tragic 54.1% |
| Cheyenne | 0.1 /100 | #280 | Tragic 54.1% |
| Colville | 0.1 /100 | #281 | Tragic 54.1% |
| Guyanese | 0.1 /100 | #282 | Tragic 54.1% |
| Nicaraguans | 0.1 /100 | #283 | Tragic 53.9% |
| Ute | 0.1 /100 | #284 | Tragic 53.8% |
| Immigrants | Guyana | 0.1 /100 | #285 | Tragic 53.5% |
| Central American Indians | 0.1 /100 | #286 | Tragic 53.5% |
| Immigrants | Belize | 0.1 /100 | #287 | Tragic 53.5% |
| Alaska Natives | 0.0 /100 | #288 | Tragic 53.4% |
| Immigrants | Ecuador | 0.0 /100 | #289 | Tragic 53.4% |
| Alaskan Athabascans | 0.0 /100 | #290 | Tragic 53.4% |
| Cubans | 0.0 /100 | #291 | Tragic 53.4% |
Demographics Similar to Immigrants from Canada by College, 1 year or more
In terms of college, 1 year or more, the demographic groups most similar to Immigrants from Canada are Egyptian (63.1%, a difference of 0.060%), Immigrants from Moldova (63.0%, a difference of 0.070%), Immigrants from North America (63.0%, a difference of 0.080%), Armenian (63.0%, a difference of 0.17%), and Argentinean (63.2%, a difference of 0.18%).
| Demographics | Rating | Rank | College, 1 year or more |
| Immigrants | Spain | 99.4 /100 | #64 | Exceptional 63.4% |
| Maltese | 99.3 /100 | #65 | Exceptional 63.4% |
| Immigrants | Europe | 99.3 /100 | #66 | Exceptional 63.3% |
| Immigrants | Romania | 99.3 /100 | #67 | Exceptional 63.3% |
| Immigrants | Greece | 99.3 /100 | #68 | Exceptional 63.3% |
| Immigrants | Zimbabwe | 99.3 /100 | #69 | Exceptional 63.3% |
| Argentineans | 99.2 /100 | #70 | Exceptional 63.2% |
| Immigrants | Canada | 99.1 /100 | #71 | Exceptional 63.1% |
| Egyptians | 99.0 /100 | #72 | Exceptional 63.1% |
| Immigrants | Moldova | 99.0 /100 | #73 | Exceptional 63.0% |
| Immigrants | North America | 99.0 /100 | #74 | Exceptional 63.0% |
| Armenians | 98.9 /100 | #75 | Exceptional 63.0% |
| Paraguayans | 98.8 /100 | #76 | Exceptional 62.9% |
| Ethiopians | 98.8 /100 | #77 | Exceptional 62.9% |
| Immigrants | Lebanon | 98.8 /100 | #78 | Exceptional 62.9% |