Immigrants from Nicaragua vs Pennsylvania German Doctorate Degree
COMPARE
Immigrants from Nicaragua
Pennsylvania German
Doctorate Degree
Doctorate Degree Comparison
Immigrants from Nicaragua
Pennsylvania Germans
1.4%
DOCTORATE DEGREE
0.1/ 100
METRIC RATING
312th/ 347
METRIC RANK
1.4%
DOCTORATE DEGREE
0.1/ 100
METRIC RATING
305th/ 347
METRIC RANK
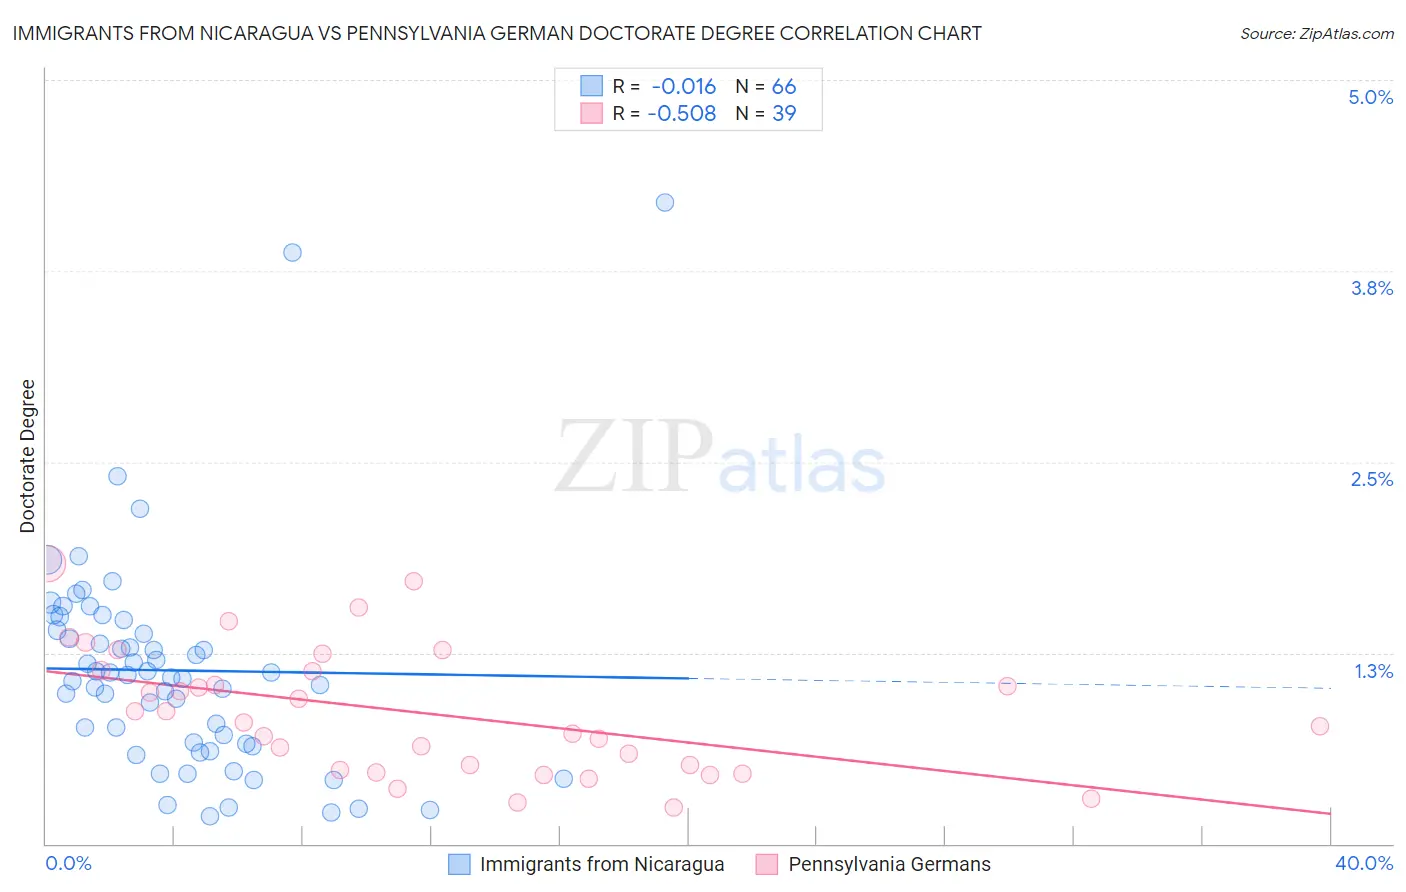
Immigrants from Nicaragua vs Pennsylvania German Doctorate Degree Correlation Chart
The statistical analysis conducted on geographies consisting of 234,843,041 people shows no correlation between the proportion of Immigrants from Nicaragua and percentage of population with at least doctorate degree education in the United States with a correlation coefficient (R) of -0.016 and weighted average of 1.4%. Similarly, the statistical analysis conducted on geographies consisting of 230,381,688 people shows a substantial negative correlation between the proportion of Pennsylvania Germans and percentage of population with at least doctorate degree education in the United States with a correlation coefficient (R) of -0.508 and weighted average of 1.4%, a difference of 1.6%.
Doctorate Degree Correlation Summary
| Measurement | Immigrants from Nicaragua | Pennsylvania German |
| Minimum | 0.18% | 0.24% |
| Maximum | 4.2% | 1.8% |
| Range | 4.0% | 1.6% |
| Mean | 1.1% | 0.86% |
| Median | 1.1% | 0.80% |
| Interquartile 25% (IQ1) | 0.66% | 0.48% |
| Interquartile 75% (IQ3) | 1.4% | 1.1% |
| Interquartile Range (IQR) | 0.74% | 0.65% |
| Standard Deviation (Sample) | 0.71% | 0.41% |
| Standard Deviation (Population) | 0.71% | 0.41% |
Demographics Similar to Immigrants from Nicaragua and Pennsylvania Germans by Doctorate Degree
In terms of doctorate degree, the demographic groups most similar to Immigrants from Nicaragua are Menominee (1.4%, a difference of 0.32%), Immigrants from Honduras (1.4%, a difference of 0.38%), Dominican (1.4%, a difference of 0.39%), Immigrants from the Azores (1.4%, a difference of 0.42%), and Immigrants from Jamaica (1.4%, a difference of 0.55%). Similarly, the demographic groups most similar to Pennsylvania Germans are Guyanese (1.4%, a difference of 0.010%), Mexican American Indian (1.4%, a difference of 0.13%), Immigrants from Dominica (1.4%, a difference of 0.19%), Shoshone (1.4%, a difference of 0.22%), and Cuban (1.4%, a difference of 0.26%).
| Demographics | Rating | Rank | Doctorate Degree |
| Puerto Ricans | 0.1 /100 | #298 | Tragic 1.4% |
| Belizeans | 0.1 /100 | #299 | Tragic 1.4% |
| Immigrants | Guatemala | 0.1 /100 | #300 | Tragic 1.4% |
| Hondurans | 0.1 /100 | #301 | Tragic 1.4% |
| Shoshone | 0.1 /100 | #302 | Tragic 1.4% |
| Immigrants | Dominica | 0.1 /100 | #303 | Tragic 1.4% |
| Mexican American Indians | 0.1 /100 | #304 | Tragic 1.4% |
| Pennsylvania Germans | 0.1 /100 | #305 | Tragic 1.4% |
| Guyanese | 0.1 /100 | #306 | Tragic 1.4% |
| Cubans | 0.1 /100 | #307 | Tragic 1.4% |
| Immigrants | Laos | 0.1 /100 | #308 | Tragic 1.4% |
| Immigrants | Grenada | 0.1 /100 | #309 | Tragic 1.4% |
| Immigrants | Jamaica | 0.1 /100 | #310 | Tragic 1.4% |
| Immigrants | Honduras | 0.1 /100 | #311 | Tragic 1.4% |
| Immigrants | Nicaragua | 0.1 /100 | #312 | Tragic 1.4% |
| Menominee | 0.1 /100 | #313 | Tragic 1.4% |
| Dominicans | 0.1 /100 | #314 | Tragic 1.4% |
| Immigrants | Azores | 0.1 /100 | #315 | Tragic 1.4% |
| Navajo | 0.1 /100 | #316 | Tragic 1.4% |
| Immigrants | Micronesia | 0.1 /100 | #317 | Tragic 1.3% |
| Creek | 0.1 /100 | #318 | Tragic 1.3% |