Immigrants from Cabo Verde vs Pennsylvania German Doctorate Degree
COMPARE
Immigrants from Cabo Verde
Pennsylvania German
Doctorate Degree
Doctorate Degree Comparison
Immigrants from Cabo Verde
Pennsylvania Germans
1.3%
DOCTORATE DEGREE
0.0/ 100
METRIC RATING
326th/ 347
METRIC RANK
1.4%
DOCTORATE DEGREE
0.1/ 100
METRIC RATING
305th/ 347
METRIC RANK
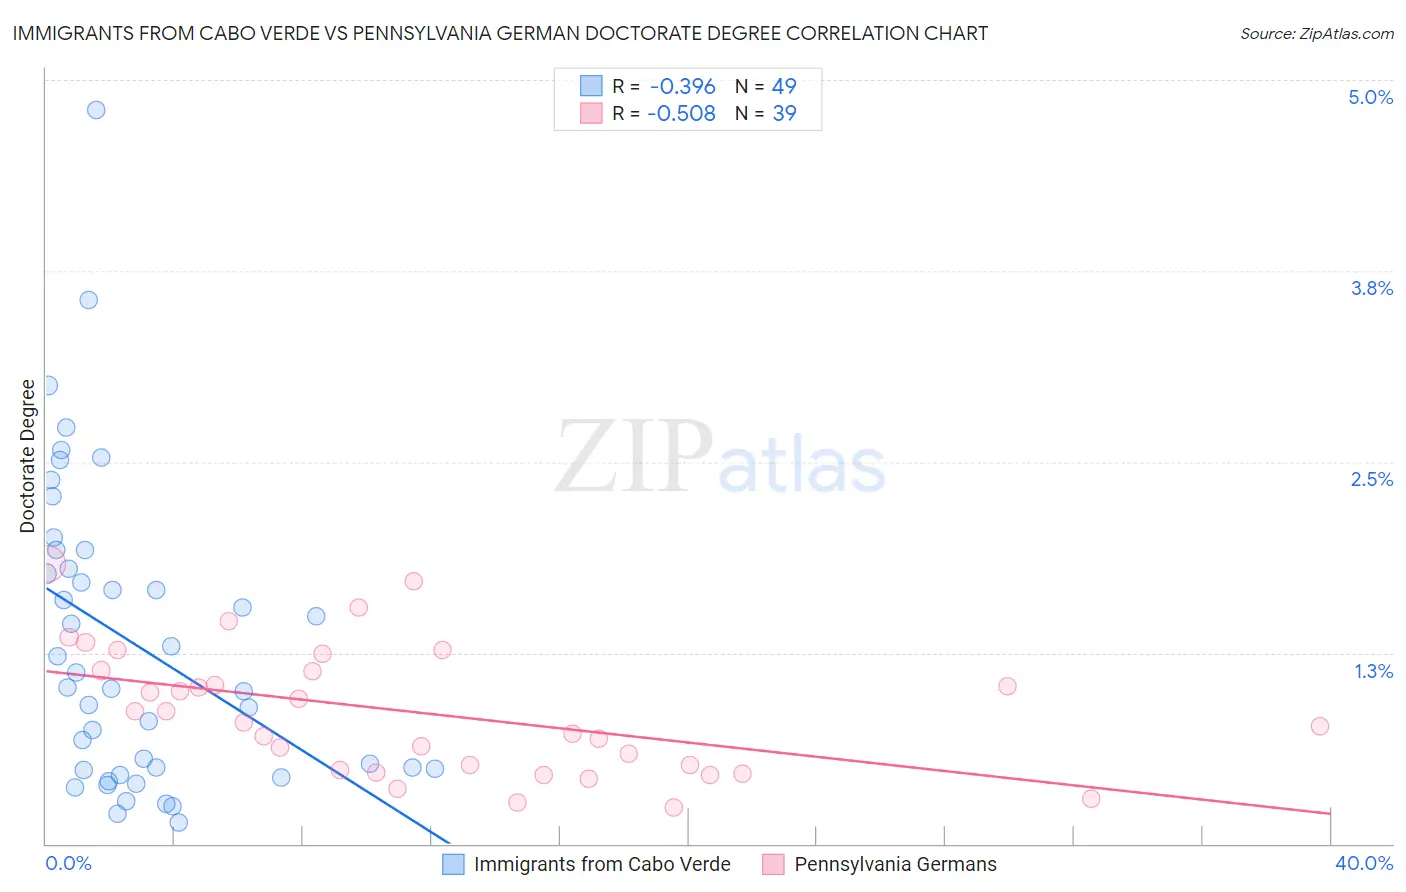
Immigrants from Cabo Verde vs Pennsylvania German Doctorate Degree Correlation Chart
The statistical analysis conducted on geographies consisting of 38,072,290 people shows a mild negative correlation between the proportion of Immigrants from Cabo Verde and percentage of population with at least doctorate degree education in the United States with a correlation coefficient (R) of -0.396 and weighted average of 1.3%. Similarly, the statistical analysis conducted on geographies consisting of 230,381,688 people shows a substantial negative correlation between the proportion of Pennsylvania Germans and percentage of population with at least doctorate degree education in the United States with a correlation coefficient (R) of -0.508 and weighted average of 1.4%, a difference of 4.7%.
Doctorate Degree Correlation Summary
| Measurement | Immigrants from Cabo Verde | Pennsylvania German |
| Minimum | 0.14% | 0.24% |
| Maximum | 4.8% | 1.8% |
| Range | 4.7% | 1.6% |
| Mean | 1.3% | 0.86% |
| Median | 1.0% | 0.80% |
| Interquartile 25% (IQ1) | 0.49% | 0.48% |
| Interquartile 75% (IQ3) | 1.9% | 1.1% |
| Interquartile Range (IQR) | 1.4% | 0.65% |
| Standard Deviation (Sample) | 0.99% | 0.41% |
| Standard Deviation (Population) | 0.98% | 0.41% |
Similar Demographics by Doctorate Degree
Demographics Similar to Immigrants from Cabo Verde by Doctorate Degree
In terms of doctorate degree, the demographic groups most similar to Immigrants from Cabo Verde are Pima (1.3%, a difference of 0.020%), Hispanic or Latino (1.3%, a difference of 0.29%), Native/Alaskan (1.3%, a difference of 0.41%), Immigrants from Belize (1.3%, a difference of 0.74%), and Inupiat (1.3%, a difference of 0.87%).
| Demographics | Rating | Rank | Doctorate Degree |
| Immigrants | Guyana | 0.1 /100 | #319 | Tragic 1.3% |
| Immigrants | St. Vincent and the Grenadines | 0.1 /100 | #320 | Tragic 1.3% |
| Dutch West Indians | 0.1 /100 | #321 | Tragic 1.3% |
| Seminole | 0.1 /100 | #322 | Tragic 1.3% |
| Immigrants | Belize | 0.1 /100 | #323 | Tragic 1.3% |
| Natives/Alaskans | 0.0 /100 | #324 | Tragic 1.3% |
| Pima | 0.0 /100 | #325 | Tragic 1.3% |
| Immigrants | Cabo Verde | 0.0 /100 | #326 | Tragic 1.3% |
| Hispanics or Latinos | 0.0 /100 | #327 | Tragic 1.3% |
| Inupiat | 0.0 /100 | #328 | Tragic 1.3% |
| Haitians | 0.0 /100 | #329 | Tragic 1.3% |
| Yup'ik | 0.0 /100 | #330 | Tragic 1.3% |
| Immigrants | Latin America | 0.0 /100 | #331 | Tragic 1.3% |
| Yakama | 0.0 /100 | #332 | Tragic 1.3% |
| Immigrants | Caribbean | 0.0 /100 | #333 | Tragic 1.3% |
Demographics Similar to Pennsylvania Germans by Doctorate Degree
In terms of doctorate degree, the demographic groups most similar to Pennsylvania Germans are Guyanese (1.4%, a difference of 0.010%), Mexican American Indian (1.4%, a difference of 0.13%), Immigrants from Dominica (1.4%, a difference of 0.19%), Shoshone (1.4%, a difference of 0.22%), and Cuban (1.4%, a difference of 0.26%).
| Demographics | Rating | Rank | Doctorate Degree |
| Puerto Ricans | 0.1 /100 | #298 | Tragic 1.4% |
| Belizeans | 0.1 /100 | #299 | Tragic 1.4% |
| Immigrants | Guatemala | 0.1 /100 | #300 | Tragic 1.4% |
| Hondurans | 0.1 /100 | #301 | Tragic 1.4% |
| Shoshone | 0.1 /100 | #302 | Tragic 1.4% |
| Immigrants | Dominica | 0.1 /100 | #303 | Tragic 1.4% |
| Mexican American Indians | 0.1 /100 | #304 | Tragic 1.4% |
| Pennsylvania Germans | 0.1 /100 | #305 | Tragic 1.4% |
| Guyanese | 0.1 /100 | #306 | Tragic 1.4% |
| Cubans | 0.1 /100 | #307 | Tragic 1.4% |
| Immigrants | Laos | 0.1 /100 | #308 | Tragic 1.4% |
| Immigrants | Grenada | 0.1 /100 | #309 | Tragic 1.4% |
| Immigrants | Jamaica | 0.1 /100 | #310 | Tragic 1.4% |
| Immigrants | Honduras | 0.1 /100 | #311 | Tragic 1.4% |
| Immigrants | Nicaragua | 0.1 /100 | #312 | Tragic 1.4% |