U.S. Virgin Islander vs Pennsylvania German Unemployment Among Women with Children Under 6 years
COMPARE
U.S. Virgin Islander
Pennsylvania German
Unemployment Among Women with Children Under 6 years
Unemployment Among Women with Children Under 6 years Comparison
U.S. Virgin Islanders
Pennsylvania Germans
8.7%
UNEMPLOYMENT AMONG WOMEN WITH CHILDREN UNDER 6 YEARS
0.0/ 100
METRIC RATING
285th/ 347
METRIC RANK
10.8%
UNEMPLOYMENT AMONG WOMEN WITH CHILDREN UNDER 6 YEARS
0.0/ 100
METRIC RATING
330th/ 347
METRIC RANK
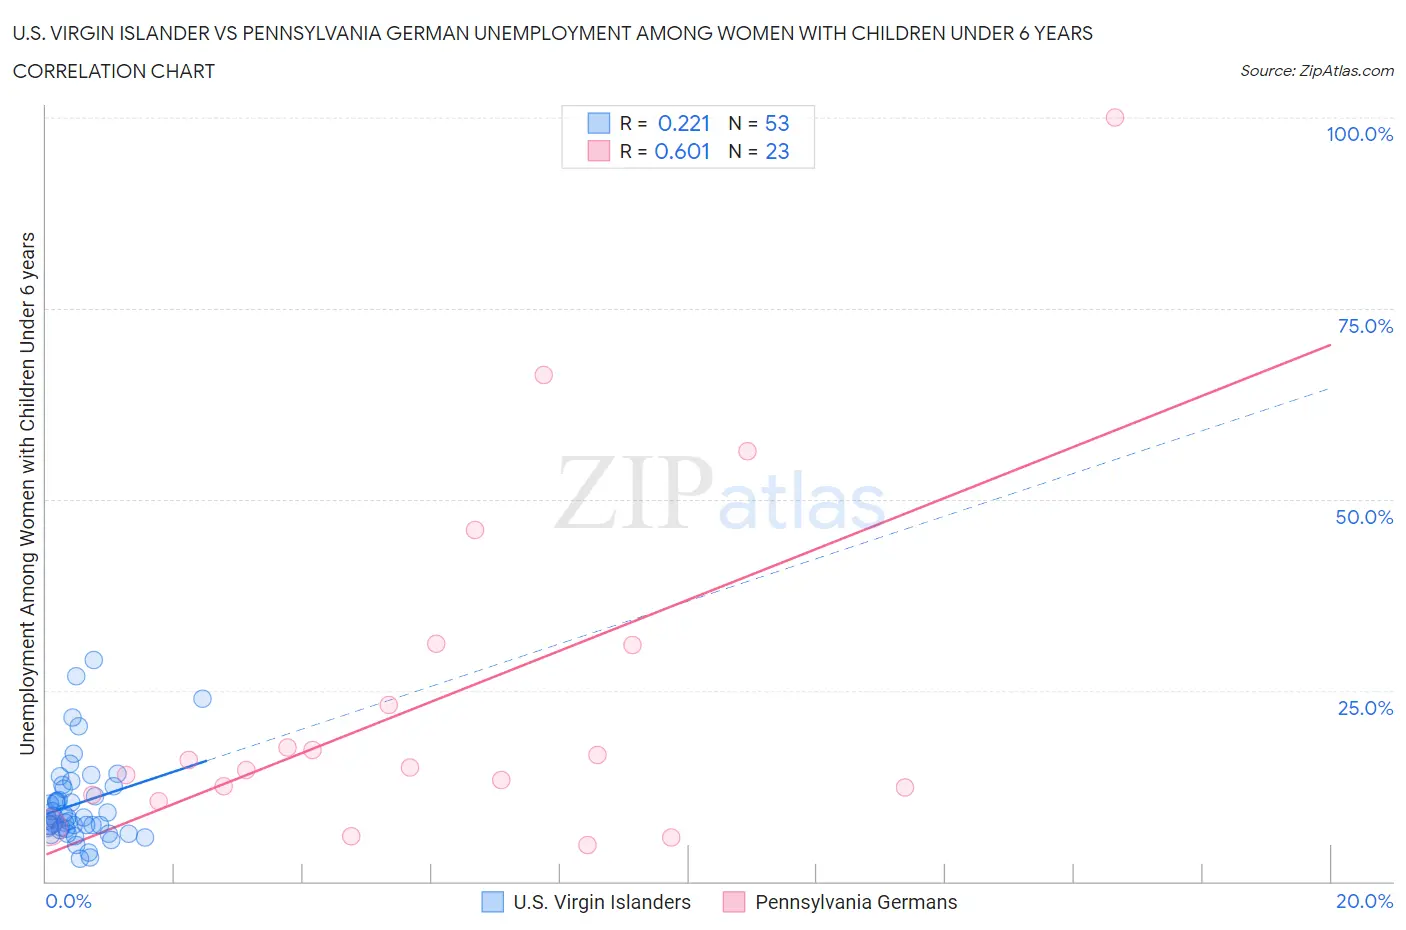
U.S. Virgin Islander vs Pennsylvania German Unemployment Among Women with Children Under 6 years Correlation Chart
The statistical analysis conducted on geographies consisting of 81,534,481 people shows a weak positive correlation between the proportion of U.S. Virgin Islanders and unemployment rate among women with children under the age of 6 in the United States with a correlation coefficient (R) of 0.221 and weighted average of 8.7%. Similarly, the statistical analysis conducted on geographies consisting of 181,724,497 people shows a significant positive correlation between the proportion of Pennsylvania Germans and unemployment rate among women with children under the age of 6 in the United States with a correlation coefficient (R) of 0.601 and weighted average of 10.8%, a difference of 23.8%.
Unemployment Among Women with Children Under 6 years Correlation Summary
| Measurement | U.S. Virgin Islander | Pennsylvania German |
| Minimum | 2.9% | 4.7% |
| Maximum | 29.0% | 100.0% |
| Range | 26.1% | 95.3% |
| Mean | 10.2% | 23.8% |
| Median | 8.3% | 14.9% |
| Interquartile 25% (IQ1) | 6.9% | 11.3% |
| Interquartile 75% (IQ3) | 12.3% | 31.0% |
| Interquartile Range (IQR) | 5.4% | 19.7% |
| Standard Deviation (Sample) | 5.6% | 23.1% |
| Standard Deviation (Population) | 5.5% | 22.6% |
Similar Demographics by Unemployment Among Women with Children Under 6 years
Demographics Similar to U.S. Virgin Islanders by Unemployment Among Women with Children Under 6 years
In terms of unemployment among women with children under 6 years, the demographic groups most similar to U.S. Virgin Islanders are Seminole (8.7%, a difference of 0.0%), Menominee (8.7%, a difference of 0.15%), Blackfeet (8.7%, a difference of 0.20%), Bahamian (8.7%, a difference of 0.35%), and Spanish American Indian (8.7%, a difference of 0.36%).
| Demographics | Rating | Rank | Unemployment Among Women with Children Under 6 years |
| Immigrants | Dominica | 0.0 /100 | #278 | Tragic 8.6% |
| Immigrants | Guatemala | 0.0 /100 | #279 | Tragic 8.6% |
| Immigrants | Belize | 0.0 /100 | #280 | Tragic 8.6% |
| Guatemalans | 0.0 /100 | #281 | Tragic 8.7% |
| Bermudans | 0.0 /100 | #282 | Tragic 8.7% |
| Spanish American Indians | 0.0 /100 | #283 | Tragic 8.7% |
| Blackfeet | 0.0 /100 | #284 | Tragic 8.7% |
| U.S. Virgin Islanders | 0.0 /100 | #285 | Tragic 8.7% |
| Seminole | 0.0 /100 | #286 | Tragic 8.7% |
| Menominee | 0.0 /100 | #287 | Tragic 8.7% |
| Bahamians | 0.0 /100 | #288 | Tragic 8.7% |
| Iroquois | 0.0 /100 | #289 | Tragic 8.7% |
| Vietnamese | 0.0 /100 | #290 | Tragic 8.8% |
| Jamaicans | 0.0 /100 | #291 | Tragic 8.8% |
| Cheyenne | 0.0 /100 | #292 | Tragic 8.8% |
Demographics Similar to Pennsylvania Germans by Unemployment Among Women with Children Under 6 years
In terms of unemployment among women with children under 6 years, the demographic groups most similar to Pennsylvania Germans are Colville (11.2%, a difference of 3.6%), Black/African American (10.3%, a difference of 4.8%), Tohono O'odham (10.2%, a difference of 5.6%), Sioux (11.5%, a difference of 6.4%), and Native/Alaskan (11.5%, a difference of 7.0%).
| Demographics | Rating | Rank | Unemployment Among Women with Children Under 6 years |
| Immigrants | Bahamas | 0.0 /100 | #323 | Tragic 9.6% |
| Paiute | 0.0 /100 | #324 | Tragic 9.7% |
| Choctaw | 0.0 /100 | #325 | Tragic 9.8% |
| Delaware | 0.0 /100 | #326 | Tragic 9.8% |
| Ottawa | 0.0 /100 | #327 | Tragic 9.9% |
| Tohono O'odham | 0.0 /100 | #328 | Tragic 10.2% |
| Blacks/African Americans | 0.0 /100 | #329 | Tragic 10.3% |
| Pennsylvania Germans | 0.0 /100 | #330 | Tragic 10.8% |
| Colville | 0.0 /100 | #331 | Tragic 11.2% |
| Sioux | 0.0 /100 | #332 | Tragic 11.5% |
| Natives/Alaskans | 0.0 /100 | #333 | Tragic 11.5% |
| Apache | 0.0 /100 | #334 | Tragic 12.3% |
| Puerto Ricans | 0.0 /100 | #335 | Tragic 12.5% |
| Shoshone | 0.0 /100 | #336 | Tragic 13.2% |
| Chippewa | 0.0 /100 | #337 | Tragic 13.3% |