Jamaican vs Pennsylvania German Doctorate Degree
COMPARE
Jamaican
Pennsylvania German
Doctorate Degree
Doctorate Degree Comparison
Jamaicans
Pennsylvania Germans
1.5%
DOCTORATE DEGREE
0.3/ 100
METRIC RATING
284th/ 347
METRIC RANK
1.4%
DOCTORATE DEGREE
0.1/ 100
METRIC RATING
305th/ 347
METRIC RANK
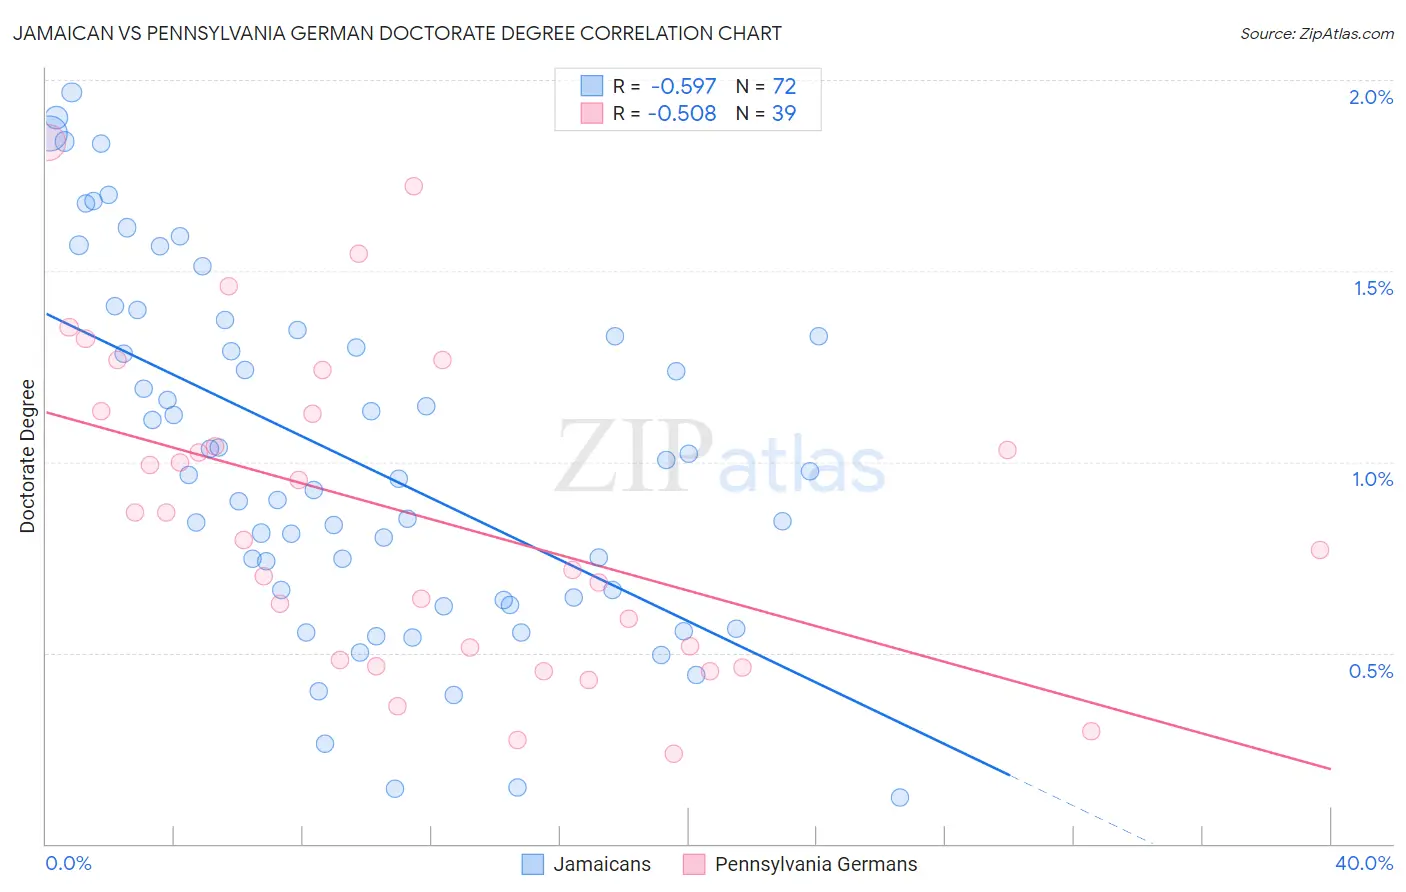
Jamaican vs Pennsylvania German Doctorate Degree Correlation Chart
The statistical analysis conducted on geographies consisting of 364,326,977 people shows a substantial negative correlation between the proportion of Jamaicans and percentage of population with at least doctorate degree education in the United States with a correlation coefficient (R) of -0.597 and weighted average of 1.5%. Similarly, the statistical analysis conducted on geographies consisting of 230,381,688 people shows a substantial negative correlation between the proportion of Pennsylvania Germans and percentage of population with at least doctorate degree education in the United States with a correlation coefficient (R) of -0.508 and weighted average of 1.4%, a difference of 5.5%.
Doctorate Degree Correlation Summary
| Measurement | Jamaican | Pennsylvania German |
| Minimum | 0.12% | 0.24% |
| Maximum | 2.0% | 1.8% |
| Range | 1.8% | 1.6% |
| Mean | 1.0% | 0.86% |
| Median | 0.96% | 0.80% |
| Interquartile 25% (IQ1) | 0.64% | 0.48% |
| Interquartile 75% (IQ3) | 1.3% | 1.1% |
| Interquartile Range (IQR) | 0.69% | 0.65% |
| Standard Deviation (Sample) | 0.46% | 0.41% |
| Standard Deviation (Population) | 0.46% | 0.41% |
Similar Demographics by Doctorate Degree
Demographics Similar to Jamaicans by Doctorate Degree
In terms of doctorate degree, the demographic groups most similar to Jamaicans are Malaysian (1.5%, a difference of 0.030%), Central American (1.5%, a difference of 0.040%), British West Indian (1.5%, a difference of 0.090%), Tohono O'odham (1.5%, a difference of 0.14%), and Ecuadorian (1.5%, a difference of 0.20%).
| Demographics | Rating | Rank | Doctorate Degree |
| Bahamians | 0.4 /100 | #277 | Tragic 1.5% |
| Hawaiians | 0.4 /100 | #278 | Tragic 1.5% |
| Marshallese | 0.4 /100 | #279 | Tragic 1.5% |
| Ecuadorians | 0.4 /100 | #280 | Tragic 1.5% |
| Tohono O'odham | 0.4 /100 | #281 | Tragic 1.5% |
| British West Indians | 0.3 /100 | #282 | Tragic 1.5% |
| Central Americans | 0.3 /100 | #283 | Tragic 1.5% |
| Jamaicans | 0.3 /100 | #284 | Tragic 1.5% |
| Malaysians | 0.3 /100 | #285 | Tragic 1.5% |
| Cherokee | 0.3 /100 | #286 | Tragic 1.5% |
| Cajuns | 0.3 /100 | #287 | Tragic 1.5% |
| Immigrants | El Salvador | 0.3 /100 | #288 | Tragic 1.4% |
| Cape Verdeans | 0.3 /100 | #289 | Tragic 1.4% |
| Choctaw | 0.3 /100 | #290 | Tragic 1.4% |
| Blacks/African Americans | 0.3 /100 | #291 | Tragic 1.4% |
Demographics Similar to Pennsylvania Germans by Doctorate Degree
In terms of doctorate degree, the demographic groups most similar to Pennsylvania Germans are Guyanese (1.4%, a difference of 0.010%), Mexican American Indian (1.4%, a difference of 0.13%), Immigrants from Dominica (1.4%, a difference of 0.19%), Shoshone (1.4%, a difference of 0.22%), and Cuban (1.4%, a difference of 0.26%).
| Demographics | Rating | Rank | Doctorate Degree |
| Puerto Ricans | 0.1 /100 | #298 | Tragic 1.4% |
| Belizeans | 0.1 /100 | #299 | Tragic 1.4% |
| Immigrants | Guatemala | 0.1 /100 | #300 | Tragic 1.4% |
| Hondurans | 0.1 /100 | #301 | Tragic 1.4% |
| Shoshone | 0.1 /100 | #302 | Tragic 1.4% |
| Immigrants | Dominica | 0.1 /100 | #303 | Tragic 1.4% |
| Mexican American Indians | 0.1 /100 | #304 | Tragic 1.4% |
| Pennsylvania Germans | 0.1 /100 | #305 | Tragic 1.4% |
| Guyanese | 0.1 /100 | #306 | Tragic 1.4% |
| Cubans | 0.1 /100 | #307 | Tragic 1.4% |
| Immigrants | Laos | 0.1 /100 | #308 | Tragic 1.4% |
| Immigrants | Grenada | 0.1 /100 | #309 | Tragic 1.4% |
| Immigrants | Jamaica | 0.1 /100 | #310 | Tragic 1.4% |
| Immigrants | Honduras | 0.1 /100 | #311 | Tragic 1.4% |
| Immigrants | Nicaragua | 0.1 /100 | #312 | Tragic 1.4% |