Guyanese vs Soviet Union Master's Degree
COMPARE
Guyanese
Soviet Union
Master's Degree
Master's Degree Comparison
Guyanese
Soviet Union
13.7%
MASTER'S DEGREE
7.6/ 100
METRIC RATING
231st/ 347
METRIC RANK
20.5%
MASTER'S DEGREE
100.0/ 100
METRIC RATING
18th/ 347
METRIC RANK
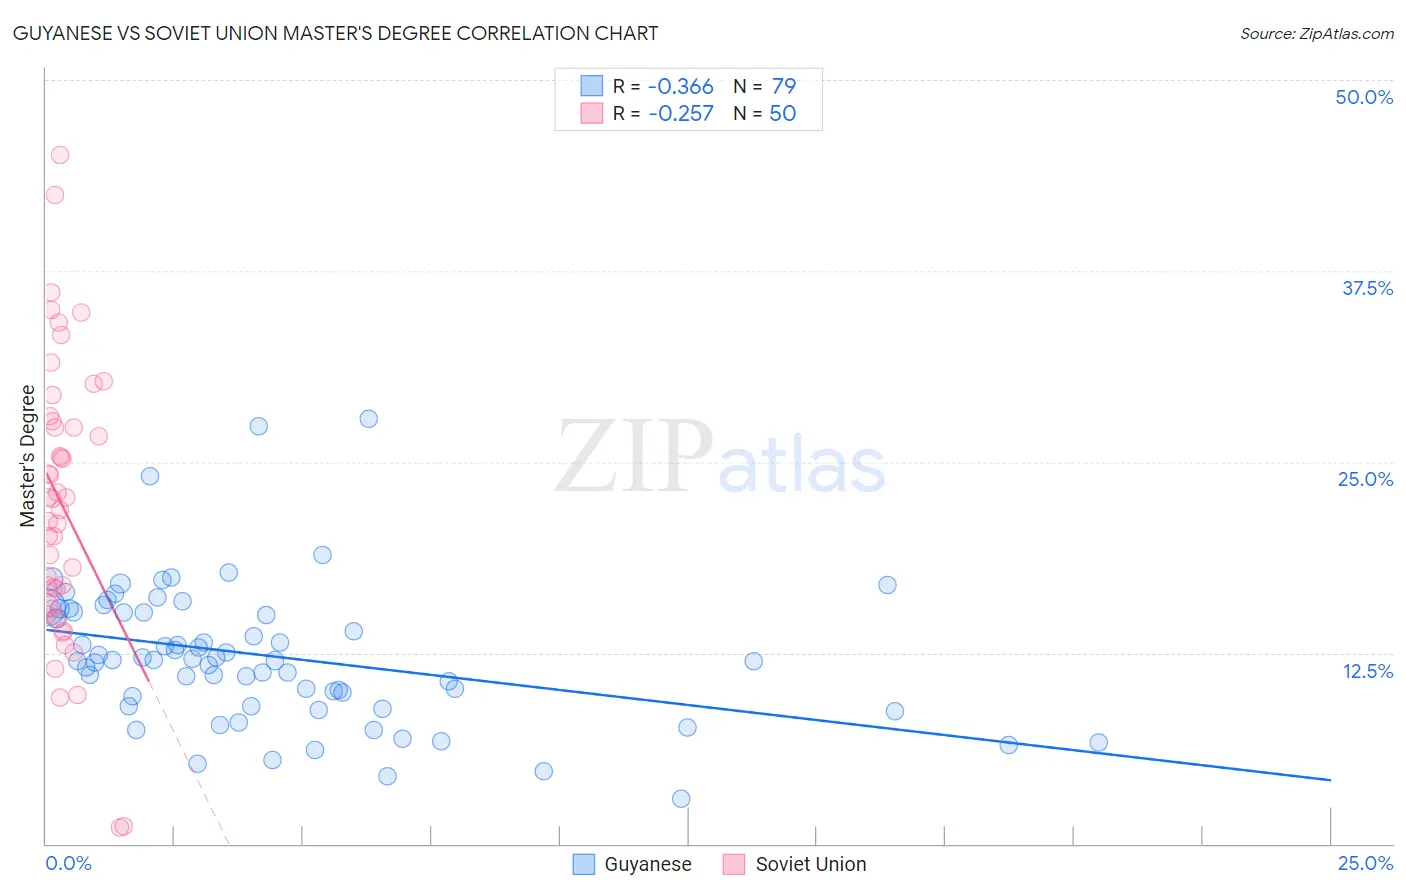
Guyanese vs Soviet Union Master's Degree Correlation Chart
The statistical analysis conducted on geographies consisting of 176,878,343 people shows a mild negative correlation between the proportion of Guyanese and percentage of population with at least master's degree education in the United States with a correlation coefficient (R) of -0.366 and weighted average of 13.7%. Similarly, the statistical analysis conducted on geographies consisting of 43,514,626 people shows a weak negative correlation between the proportion of Soviet Union and percentage of population with at least master's degree education in the United States with a correlation coefficient (R) of -0.257 and weighted average of 20.5%, a difference of 49.5%.
Master's Degree Correlation Summary
| Measurement | Guyanese | Soviet Union |
| Minimum | 3.0% | 1.0% |
| Maximum | 27.9% | 45.1% |
| Range | 24.9% | 44.1% |
| Mean | 12.3% | 22.1% |
| Median | 12.0% | 22.2% |
| Interquartile 25% (IQ1) | 9.0% | 15.6% |
| Interquartile 75% (IQ3) | 15.2% | 27.6% |
| Interquartile Range (IQR) | 6.2% | 12.0% |
| Standard Deviation (Sample) | 4.6% | 9.2% |
| Standard Deviation (Population) | 4.6% | 9.1% |
Similar Demographics by Master's Degree
Demographics Similar to Guyanese by Master's Degree
In terms of master's degree, the demographic groups most similar to Guyanese are Dutch (13.8%, a difference of 0.55%), British West Indian (13.8%, a difference of 0.58%), White/Caucasian (13.8%, a difference of 0.68%), Immigrants from Philippines (13.6%, a difference of 0.88%), and Immigrants from West Indies (13.9%, a difference of 1.0%).
| Demographics | Rating | Rank | Master's Degree |
| Immigrants | Grenada | 11.8 /100 | #224 | Poor 14.0% |
| Portuguese | 11.2 /100 | #225 | Poor 13.9% |
| Immigrants | St. Vincent and the Grenadines | 11.0 /100 | #226 | Poor 13.9% |
| Immigrants | West Indies | 9.8 /100 | #227 | Tragic 13.9% |
| Whites/Caucasians | 9.1 /100 | #228 | Tragic 13.8% |
| British West Indians | 8.8 /100 | #229 | Tragic 13.8% |
| Dutch | 8.7 /100 | #230 | Tragic 13.8% |
| Guyanese | 7.6 /100 | #231 | Tragic 13.7% |
| Immigrants | Philippines | 6.0 /100 | #232 | Tragic 13.6% |
| Immigrants | Ecuador | 5.7 /100 | #233 | Tragic 13.6% |
| Immigrants | Burma/Myanmar | 5.0 /100 | #234 | Tragic 13.5% |
| German Russians | 4.5 /100 | #235 | Tragic 13.5% |
| Immigrants | Guyana | 4.4 /100 | #236 | Tragic 13.4% |
| Jamaicans | 4.1 /100 | #237 | Tragic 13.4% |
| Hmong | 4.0 /100 | #238 | Tragic 13.4% |
Demographics Similar to Soviet Union by Master's Degree
In terms of master's degree, the demographic groups most similar to Soviet Union are Immigrants from Hong Kong (20.5%, a difference of 0.35%), Indian (Asian) (20.5%, a difference of 0.37%), Immigrants from Ireland (20.4%, a difference of 0.48%), Israeli (20.3%, a difference of 0.90%), and Immigrants from South Central Asia (20.7%, a difference of 0.92%).
| Demographics | Rating | Rank | Master's Degree |
| Immigrants | China | 100.0 /100 | #11 | Exceptional 21.2% |
| Eastern Europeans | 100.0 /100 | #12 | Exceptional 21.1% |
| Immigrants | Australia | 100.0 /100 | #13 | Exceptional 20.9% |
| Immigrants | Switzerland | 100.0 /100 | #14 | Exceptional 20.9% |
| Immigrants | Eastern Asia | 100.0 /100 | #15 | Exceptional 20.8% |
| Immigrants | Belgium | 100.0 /100 | #16 | Exceptional 20.8% |
| Immigrants | South Central Asia | 100.0 /100 | #17 | Exceptional 20.7% |
| Soviet Union | 100.0 /100 | #18 | Exceptional 20.5% |
| Immigrants | Hong Kong | 100.0 /100 | #19 | Exceptional 20.5% |
| Indians (Asian) | 100.0 /100 | #20 | Exceptional 20.5% |
| Immigrants | Ireland | 100.0 /100 | #21 | Exceptional 20.4% |
| Israelis | 100.0 /100 | #22 | Exceptional 20.3% |
| Immigrants | France | 100.0 /100 | #23 | Exceptional 20.3% |
| Immigrants | Sweden | 100.0 /100 | #24 | Exceptional 20.3% |
| Immigrants | Japan | 100.0 /100 | #25 | Exceptional 20.0% |