Turkish vs Immigrants from Burma/Myanmar GED/Equivalency
COMPARE
Turkish
Immigrants from Burma/Myanmar
GED/Equivalency
GED/Equivalency Comparison
Turks
Immigrants from Burma/Myanmar
88.5%
GED/EQUIVALENCY
99.8/ 100
METRIC RATING
30th/ 347
METRIC RANK
83.0%
GED/EQUIVALENCY
0.2/ 100
METRIC RATING
268th/ 347
METRIC RANK
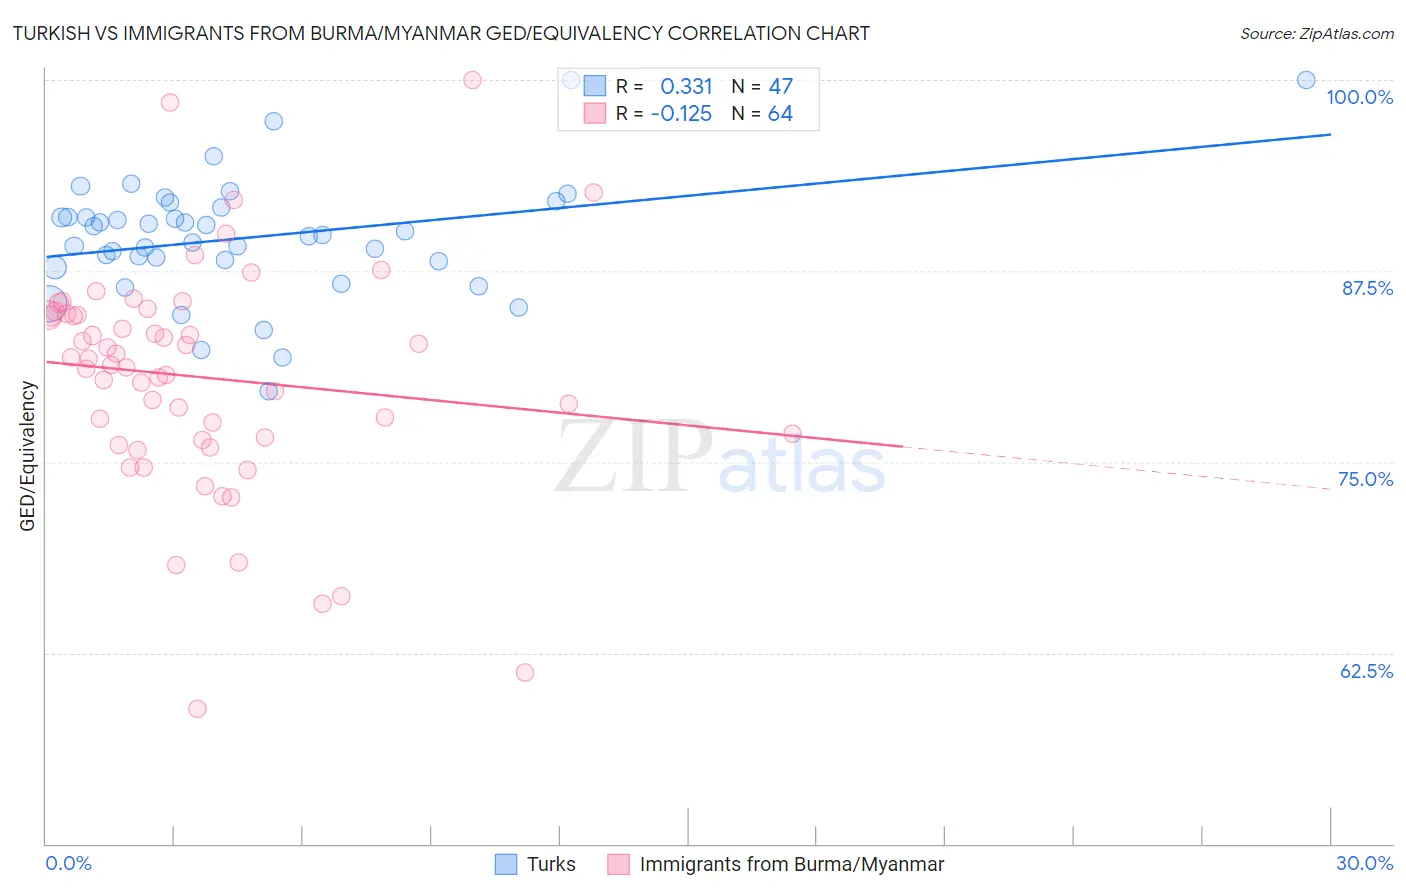
Turkish vs Immigrants from Burma/Myanmar GED/Equivalency Correlation Chart
The statistical analysis conducted on geographies consisting of 271,864,133 people shows a mild positive correlation between the proportion of Turks and percentage of population with at least ged/equivalency education in the United States with a correlation coefficient (R) of 0.331 and weighted average of 88.5%. Similarly, the statistical analysis conducted on geographies consisting of 172,357,706 people shows a poor negative correlation between the proportion of Immigrants from Burma/Myanmar and percentage of population with at least ged/equivalency education in the United States with a correlation coefficient (R) of -0.125 and weighted average of 83.0%, a difference of 6.6%.
GED/Equivalency Correlation Summary
| Measurement | Turkish | Immigrants from Burma/Myanmar |
| Minimum | 79.7% | 58.8% |
| Maximum | 100.0% | 100.0% |
| Range | 20.3% | 41.2% |
| Mean | 89.7% | 80.5% |
| Median | 89.9% | 81.5% |
| Interquartile 25% (IQ1) | 88.1% | 76.5% |
| Interquartile 75% (IQ3) | 91.7% | 84.7% |
| Interquartile Range (IQR) | 3.5% | 8.1% |
| Standard Deviation (Sample) | 4.0% | 7.5% |
| Standard Deviation (Population) | 4.0% | 7.4% |
Similar Demographics by GED/Equivalency
Demographics Similar to Turks by GED/Equivalency
In terms of ged/equivalency, the demographic groups most similar to Turks are Polish (88.5%, a difference of 0.020%), Bhutanese (88.4%, a difference of 0.030%), Immigrants from Northern Europe (88.5%, a difference of 0.050%), Danish (88.4%, a difference of 0.050%), and Immigrants from Lithuania (88.6%, a difference of 0.090%).
| Demographics | Rating | Rank | GED/Equivalency |
| Russians | 99.8 /100 | #23 | Exceptional 88.6% |
| Slovaks | 99.8 /100 | #24 | Exceptional 88.6% |
| Estonians | 99.8 /100 | #25 | Exceptional 88.6% |
| Immigrants | Australia | 99.8 /100 | #26 | Exceptional 88.6% |
| Immigrants | Lithuania | 99.8 /100 | #27 | Exceptional 88.6% |
| Immigrants | Northern Europe | 99.8 /100 | #28 | Exceptional 88.5% |
| Poles | 99.8 /100 | #29 | Exceptional 88.5% |
| Turks | 99.8 /100 | #30 | Exceptional 88.5% |
| Bhutanese | 99.8 /100 | #31 | Exceptional 88.4% |
| Danes | 99.8 /100 | #32 | Exceptional 88.4% |
| Immigrants | Sweden | 99.7 /100 | #33 | Exceptional 88.4% |
| Immigrants | Japan | 99.7 /100 | #34 | Exceptional 88.4% |
| Immigrants | South Central Asia | 99.7 /100 | #35 | Exceptional 88.4% |
| Immigrants | Belgium | 99.7 /100 | #36 | Exceptional 88.3% |
| Immigrants | Austria | 99.7 /100 | #37 | Exceptional 88.3% |
Demographics Similar to Immigrants from Burma/Myanmar by GED/Equivalency
In terms of ged/equivalency, the demographic groups most similar to Immigrants from Burma/Myanmar are Trinidadian and Tobagonian (83.0%, a difference of 0.040%), Hopi (83.0%, a difference of 0.040%), West Indian (83.1%, a difference of 0.060%), Kiowa (83.1%, a difference of 0.060%), and Bangladeshi (83.1%, a difference of 0.070%).
| Demographics | Rating | Rank | GED/Equivalency |
| Inupiat | 0.2 /100 | #261 | Tragic 83.1% |
| Immigrants | Armenia | 0.2 /100 | #262 | Tragic 83.1% |
| Immigrants | Congo | 0.2 /100 | #263 | Tragic 83.1% |
| Bangladeshis | 0.2 /100 | #264 | Tragic 83.1% |
| West Indians | 0.2 /100 | #265 | Tragic 83.1% |
| Kiowa | 0.2 /100 | #266 | Tragic 83.1% |
| Trinidadians and Tobagonians | 0.2 /100 | #267 | Tragic 83.0% |
| Immigrants | Burma/Myanmar | 0.2 /100 | #268 | Tragic 83.0% |
| Hopi | 0.2 /100 | #269 | Tragic 83.0% |
| Immigrants | Jamaica | 0.2 /100 | #270 | Tragic 82.9% |
| U.S. Virgin Islanders | 0.2 /100 | #271 | Tragic 82.9% |
| Barbadians | 0.1 /100 | #272 | Tragic 82.9% |
| Pennsylvania Germans | 0.1 /100 | #273 | Tragic 82.9% |
| Immigrants | Trinidad and Tobago | 0.1 /100 | #274 | Tragic 82.8% |
| Seminole | 0.1 /100 | #275 | Tragic 82.8% |