Yuman vs Immigrants from Jordan 9th Grade
COMPARE
Yuman
Immigrants from Jordan
9th Grade
9th Grade Comparison
Yuman
Immigrants from Jordan
93.8%
9TH GRADE
0.2/ 100
METRIC RATING
270th/ 347
METRIC RANK
95.1%
9TH GRADE
81.2/ 100
METRIC RATING
148th/ 347
METRIC RANK
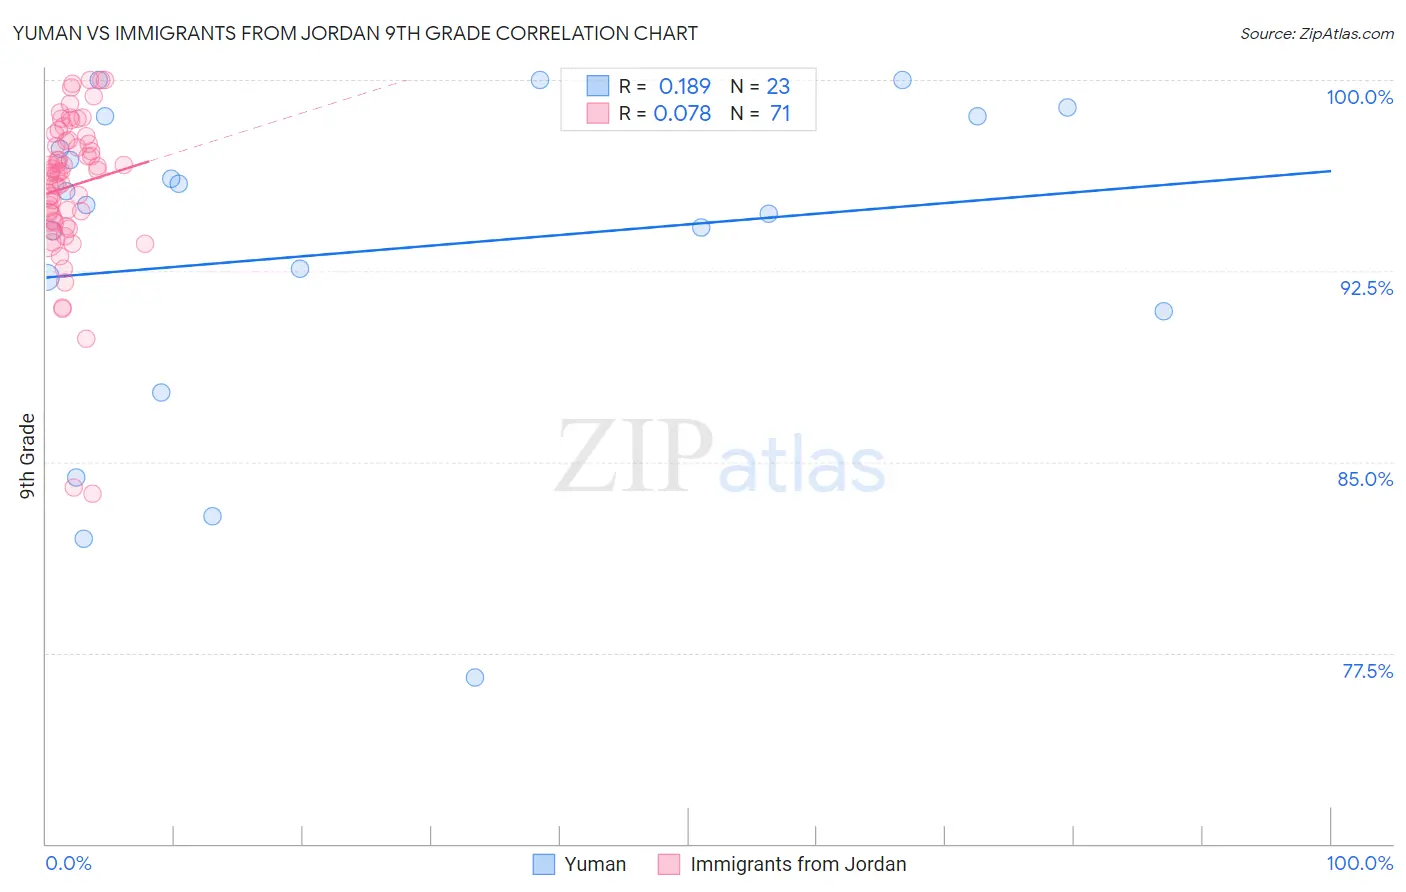
Yuman vs Immigrants from Jordan 9th Grade Correlation Chart
The statistical analysis conducted on geographies consisting of 40,696,349 people shows a poor positive correlation between the proportion of Yuman and percentage of population with at least 9th grade education in the United States with a correlation coefficient (R) of 0.189 and weighted average of 93.8%. Similarly, the statistical analysis conducted on geographies consisting of 181,278,272 people shows a slight positive correlation between the proportion of Immigrants from Jordan and percentage of population with at least 9th grade education in the United States with a correlation coefficient (R) of 0.078 and weighted average of 95.1%, a difference of 1.4%.
9th Grade Correlation Summary
| Measurement | Yuman | Immigrants from Jordan |
| Minimum | 76.5% | 83.7% |
| Maximum | 100.0% | 100.0% |
| Range | 23.5% | 16.3% |
| Mean | 93.3% | 95.8% |
| Median | 95.1% | 96.4% |
| Interquartile 25% (IQ1) | 90.9% | 94.5% |
| Interquartile 75% (IQ3) | 98.6% | 97.6% |
| Interquartile Range (IQR) | 7.7% | 3.2% |
| Standard Deviation (Sample) | 6.4% | 3.0% |
| Standard Deviation (Population) | 6.3% | 3.0% |
Similar Demographics by 9th Grade
Demographics Similar to Yuman by 9th Grade
In terms of 9th grade, the demographic groups most similar to Yuman are Immigrants from Uruguay (93.8%, a difference of 0.010%), Immigrants from Ghana (93.8%, a difference of 0.020%), Immigrants from Western Africa (93.8%, a difference of 0.030%), Immigrants from South America (93.8%, a difference of 0.040%), and Peruvian (93.8%, a difference of 0.040%).
| Demographics | Rating | Rank | 9th Grade |
| Immigrants | Uzbekistan | 0.4 /100 | #263 | Tragic 93.9% |
| Immigrants | Congo | 0.4 /100 | #264 | Tragic 93.9% |
| Natives/Alaskans | 0.4 /100 | #265 | Tragic 93.9% |
| Navajo | 0.3 /100 | #266 | Tragic 93.9% |
| Armenians | 0.3 /100 | #267 | Tragic 93.9% |
| Immigrants | Bolivia | 0.3 /100 | #268 | Tragic 93.9% |
| Immigrants | Uruguay | 0.2 /100 | #269 | Tragic 93.8% |
| Yuman | 0.2 /100 | #270 | Tragic 93.8% |
| Immigrants | Ghana | 0.2 /100 | #271 | Tragic 93.8% |
| Immigrants | Western Africa | 0.2 /100 | #272 | Tragic 93.8% |
| Immigrants | South America | 0.2 /100 | #273 | Tragic 93.8% |
| Peruvians | 0.2 /100 | #274 | Tragic 93.8% |
| Immigrants | Colombia | 0.2 /100 | #275 | Tragic 93.8% |
| West Indians | 0.2 /100 | #276 | Tragic 93.7% |
| Immigrants | Philippines | 0.1 /100 | #277 | Tragic 93.7% |
Demographics Similar to Immigrants from Jordan by 9th Grade
In terms of 9th grade, the demographic groups most similar to Immigrants from Jordan are Pueblo (95.1%, a difference of 0.010%), Immigrants from Sri Lanka (95.1%, a difference of 0.010%), Choctaw (95.1%, a difference of 0.010%), Immigrants from Korea (95.1%, a difference of 0.020%), and Kenyan (95.1%, a difference of 0.020%).
| Demographics | Rating | Rank | 9th Grade |
| Immigrants | Bosnia and Herzegovina | 85.2 /100 | #141 | Excellent 95.2% |
| Immigrants | Greece | 84.6 /100 | #142 | Excellent 95.2% |
| Spanish | 84.4 /100 | #143 | Excellent 95.2% |
| Yup'ik | 83.3 /100 | #144 | Excellent 95.2% |
| Pueblo | 82.2 /100 | #145 | Excellent 95.1% |
| Immigrants | Sri Lanka | 82.1 /100 | #146 | Excellent 95.1% |
| Choctaw | 81.9 /100 | #147 | Excellent 95.1% |
| Immigrants | Jordan | 81.2 /100 | #148 | Excellent 95.1% |
| Immigrants | Korea | 79.6 /100 | #149 | Good 95.1% |
| Kenyans | 79.1 /100 | #150 | Good 95.1% |
| Cajuns | 77.3 /100 | #151 | Good 95.1% |
| Ugandans | 77.0 /100 | #152 | Good 95.1% |
| Albanians | 76.1 /100 | #153 | Good 95.1% |
| Arabs | 74.9 /100 | #154 | Good 95.1% |
| Immigrants | Kazakhstan | 74.7 /100 | #155 | Good 95.1% |