Native/Alaskan vs Immigrants from Jordan 11th Grade

COMPARE

Native/Alaskan
Race
Ancestry
AfghanAfricanAlaska NativeAlaskan AthabascanAlbanianAleutAlsatianAmericanApacheArabArapahoArgentineanArmenianAssyrian/Chaldean/SyriacAustralianAustrianBahamianBangladeshiBarbadianBasqueBelgianBelizeanBermudanBhutaneseBlackfeetBolivianBrazilianBritishBritish West IndianBulgarianBurmeseCajunCambodianCanadianCape VerdeanCarpatho RusynCelticCentral AmericanCentral American IndianCherokeeCheyenneChickasawChileanChineseChippewaChoctawColombianColvilleComancheCosta RicanCreeCreekCroatianCrowCubanCypriotCzechCzechoslovakianDanishDelawareDominicanDutchDutch West IndianEastern EuropeanEcuadorianEgyptianEnglishEstonianEthiopianEuropeanFijianFilipinoFinnishFrenchFrench American IndianFrench CanadianGermanGerman RussianGhanaianGreekGuamanian/ChamorroGuatemalanGuyaneseHaitianHmongHonduranHopiHoumaHungarianIcelanderIndian (Asian)IndonesianInupiatIranianIraqiIrishIroquoisIsraeliItalianJamaicanJapaneseJordanianKenyanKiowaKoreanLaotianLatvianLebaneseLiberianLithuanianLumbeeLuxembourgerMacedonianMalaysianMalteseMarshalleseMenomineeMexicanMexican American IndianMongolianMoroccanNative HawaiianNavajoNepaleseNew ZealanderNicaraguanNigerianNorthern EuropeanNorwegianOkinawanOsageOttawaPaiutePakistaniPalestinianPanamanianParaguayanPennsylvania GermanPeruvianPimaPolishPortuguesePotawatomiPuebloPuerto RicanPuget Sound SalishRomanianRussianSalvadoranSamoanScandinavianScotch-IrishScottishSeminoleSenegaleseSerbianShoshoneSierra LeoneanSiouxSlavicSlovakSloveneSomaliSouth AfricanSouth AmericanSouth American IndianSoviet UnionSpaniardSpanishSpanish AmericanSpanish American IndianSri LankanSubsaharan AfricanSudaneseSwedishSwissSyrianTaiwaneseThaiTlingit-HaidaTohono O'OdhamTonganTrinidadian and TobagonianTsimshianTurkishU.S. Virgin IslanderUgandanUkrainianUruguayanUteVenezuelanVietnameseWelshWest IndianYakamaYaquiYugoslavianYumanYup'ikZimbabwean
Immigration
NonimmigrantsImmigrantsAfghanistanAfricaAlbaniaArgentinaArmeniaAsiaAustraliaAustriaBahamasBangladeshBarbadosBelarusBelgiumBelizeBoliviaBosnia and HerzegovinaBrazilBulgariaBurma/MyanmarCabo VerdeCambodiaCameroonCanadaCaribbeanCentral AmericaChileChinaColombiaCongoCosta RicaCroatiaCubaCzechoslovakiaDenmarkDominicaDominican RepublicEastern AfricaEastern AsiaEastern EuropeEcuadorEgyptEl SalvadorEnglandEritreaEthiopiaEuropeFijiFranceGermanyGhanaGreeceGrenadaGuatemalaGuyanaHaitiHondurasHong KongHungaryIndiaIndonesiaIranIraqIrelandIsraelItalyJamaicaJapanKazakhstanKenyaKoreaKuwaitLaosLatin AmericaLatviaLebanonLiberiaLithuaniaMalaysiaMexicoMicronesiaMiddle AfricaMoldovaMoroccoNepalNetherlandsNicaraguaNigeriaNorth AmericaNorth MacedoniaNorthern AfricaNorthern EuropeNorwayOceaniaPakistanPanamaPeruPhilippinesPolandPortugalRomaniaRussiaSaudi ArabiaScotlandSenegalSerbiaSierra LeoneSingaporeSomaliaSouth AfricaSouth AmericaSouth Central AsiaSouth Eastern AsiaSouthern EuropeSpainSri LankaSt. Vincent and the GrenadinesSudanSwedenSwitzerlandSyriaTaiwanThailandTrinidad and TobagoTurkeyUgandaUkraineUruguayUzbekistanVenezuelaVietnamWest IndiesWestern AfricaWestern AsiaWestern EuropeYemenZaireZimbabweAzores
Immigrants from Jordan
Race
Ancestry
AfghanAfricanAlaska NativeAlaskan AthabascanAlbanianAleutAlsatianAmericanApacheArabArapahoArgentineanArmenianAssyrian/Chaldean/SyriacAustralianAustrianBahamianBangladeshiBarbadianBasqueBelgianBelizeanBermudanBhutaneseBlackfeetBolivianBrazilianBritishBritish West IndianBulgarianBurmeseCajunCambodianCanadianCape VerdeanCarpatho RusynCelticCentral AmericanCentral American IndianCherokeeCheyenneChickasawChileanChineseChippewaChoctawColombianColvilleComancheCosta RicanCreeCreekCroatianCrowCubanCypriotCzechCzechoslovakianDanishDelawareDominicanDutchDutch West IndianEastern EuropeanEcuadorianEgyptianEnglishEstonianEthiopianEuropeanFijianFilipinoFinnishFrenchFrench American IndianFrench CanadianGermanGerman RussianGhanaianGreekGuamanian/ChamorroGuatemalanGuyaneseHaitianHmongHonduranHopiHoumaHungarianIcelanderIndian (Asian)IndonesianInupiatIranianIraqiIrishIroquoisIsraeliItalianJamaicanJapaneseJordanianKenyanKiowaKoreanLaotianLatvianLebaneseLiberianLithuanianLumbeeLuxembourgerMacedonianMalaysianMalteseMarshalleseMenomineeMexicanMexican American IndianMongolianMoroccanNative HawaiianNavajoNepaleseNew ZealanderNicaraguanNigerianNorthern EuropeanNorwegianOkinawanOsageOttawaPaiutePakistaniPalestinianPanamanianParaguayanPennsylvania GermanPeruvianPimaPolishPortuguesePotawatomiPuebloPuerto RicanPuget Sound SalishRomanianRussianSalvadoranSamoanScandinavianScotch-IrishScottishSeminoleSenegaleseSerbianShoshoneSierra LeoneanSiouxSlavicSlovakSloveneSomaliSouth AfricanSouth AmericanSouth American IndianSoviet UnionSpaniardSpanishSpanish AmericanSpanish American IndianSri LankanSubsaharan AfricanSudaneseSwedishSwissSyrianTaiwaneseThaiTlingit-HaidaTohono O'OdhamTonganTrinidadian and TobagonianTsimshianTurkishU.S. Virgin IslanderUgandanUkrainianUruguayanUteVenezuelanVietnameseWelshWest IndianYakamaYaquiYugoslavianYumanYup'ikZimbabwean
Immigration
NonimmigrantsImmigrantsAfghanistanAfricaAlbaniaArgentinaArmeniaAsiaAustraliaAustriaBahamasBangladeshBarbadosBelarusBelgiumBelizeBoliviaBosnia and HerzegovinaBrazilBulgariaBurma/MyanmarCabo VerdeCambodiaCameroonCanadaCaribbeanCentral AmericaChileChinaColombiaCongoCosta RicaCroatiaCubaCzechoslovakiaDenmarkDominicaDominican RepublicEastern AfricaEastern AsiaEastern EuropeEcuadorEgyptEl SalvadorEnglandEritreaEthiopiaEuropeFijiFranceGermanyGhanaGreeceGrenadaGuatemalaGuyanaHaitiHondurasHong KongHungaryIndiaIndonesiaIranIraqIrelandIsraelItalyJamaicaJapanJordanKazakhstanKenyaKoreaKuwaitLaosLatin AmericaLatviaLebanonLiberiaLithuaniaMalaysiaMexicoMicronesiaMiddle AfricaMoldovaMoroccoNepalNetherlandsNicaraguaNigeriaNorth AmericaNorth MacedoniaNorthern AfricaNorthern EuropeNorwayOceaniaPakistanPanamaPeruPhilippinesPolandPortugalRomaniaRussiaSaudi ArabiaScotlandSenegalSerbiaSierra LeoneSingaporeSomaliaSouth AfricaSouth AmericaSouth Central AsiaSouth Eastern AsiaSouthern EuropeSpainSri LankaSt. Vincent and the GrenadinesSudanSwedenSwitzerlandSyriaTaiwanThailandTrinidad and TobagoTurkeyUgandaUkraineUruguayUzbekistanVenezuelaVietnamWest IndiesWestern AfricaWestern AsiaWestern EuropeYemenZaireZimbabweAzores
11th Grade
Income
Poverty
Unemployment
Labor Participation
Family Structure
Vehicle Availability
Education Level
Disability

11th Grade Comparison

Natives/Alaskans

Immigrants from Jordan

Tragic
Exceptional
90.2%
11TH GRADE
0.0/ 100
METRIC RATING
293rd/ 347
METRIC RANK
93.1%
11TH GRADE
92.4/ 100
METRIC RATING
128th/ 347
METRIC RANK

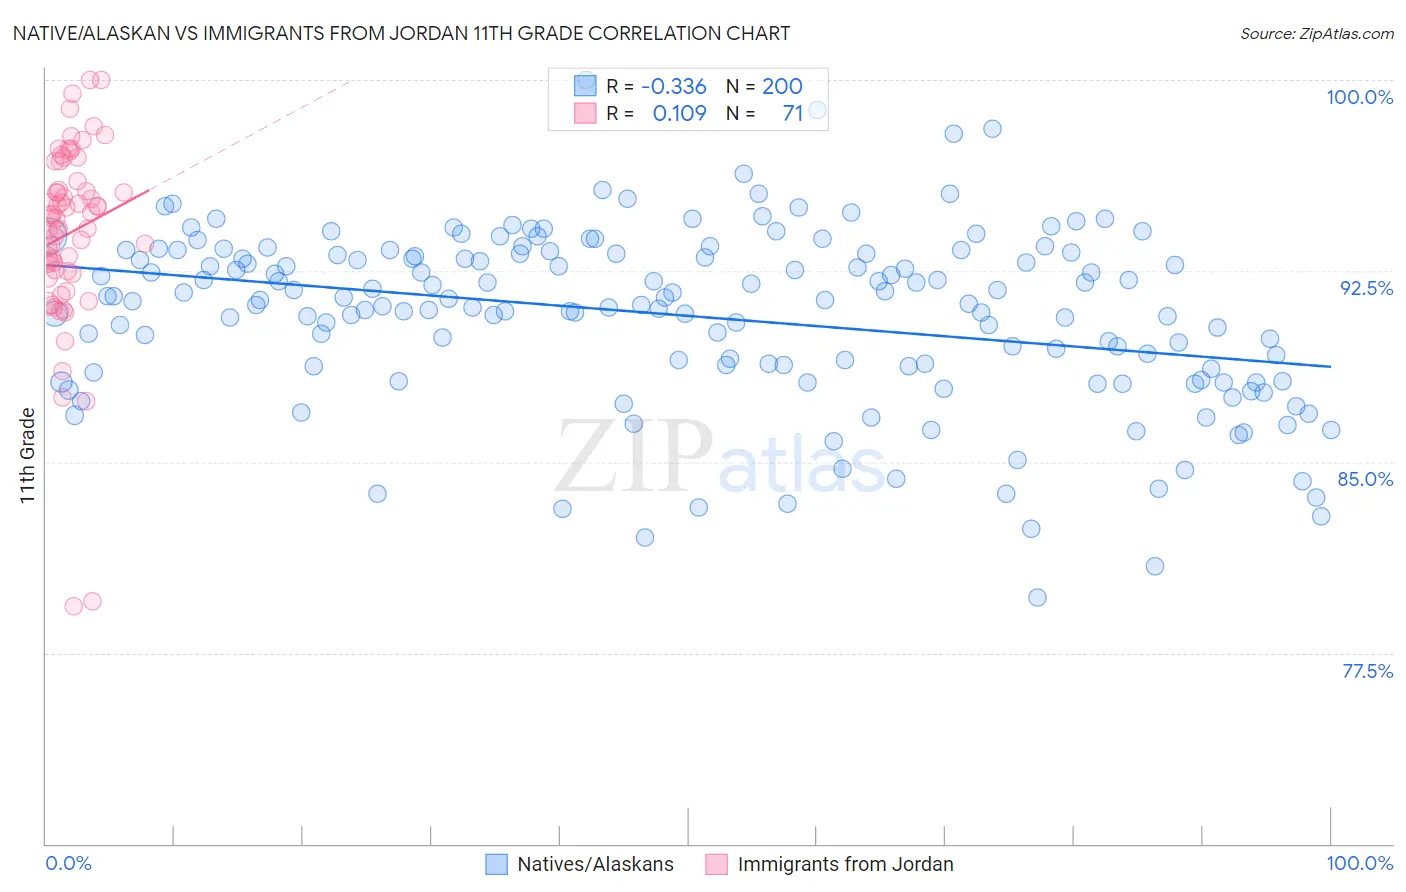
Native/Alaskan vs Immigrants from Jordan 11th Grade Correlation Chart

The statistical analysis conducted on geographies consisting of 513,075,819 people shows a mild negative correlation between the proportion of Natives/Alaskans and percentage of population with at least 11th grade education in the United States with a correlation coefficient (R) of -0.336 and weighted average of 90.2%. Similarly, the statistical analysis conducted on geographies consisting of 181,278,272 people shows a poor positive correlation between the proportion of Immigrants from Jordan and percentage of population with at least 11th grade education in the United States with a correlation coefficient (R) of 0.109 and weighted average of 93.1%, a difference of 3.2%.
Native/Alaskan vs Immigrants from Jordan 11th Grade

11th Grade Correlation Summary

MeasurementNative/AlaskanImmigrants from Jordan
Minimum79.7%79.3%
Maximum100.0%100.0%
Range20.3%20.7%
Mean90.7%94.0%
Median91.3%94.6%
Interquartile 25% (IQ1)88.7%92.5%
Interquartile 75% (IQ3)93.2%96.0%
Interquartile Range (IQR)4.5%3.5%
Standard Deviation (Sample)3.5%3.7%
Standard Deviation (Population)3.4%3.7%

Similar Demographics by 11th Grade

Demographics Similar to Natives/Alaskans by 11th Grade

In terms of 11th grade, the demographic groups most similar to Natives/Alaskans are Immigrants from Grenada (90.1%, a difference of 0.050%), Cuban (90.2%, a difference of 0.070%), Haitian (90.3%, a difference of 0.10%), Indonesian (90.3%, a difference of 0.14%), and Immigrants from Vietnam (90.0%, a difference of 0.15%).
DemographicsRating | Rank11th Grade
Immigrants | West Indies
0.0
/100
|
#286
Tragic
90.4%
Apache
0.0
/100
|
#287
Tragic
90.4%
Pennsylvania Germans
0.0
/100
|
#288
Tragic
90.3%
British West Indians
0.0
/100
|
#289
Tragic
90.3%
Indonesians
0.0
/100
|
#290
Tragic
90.3%
Haitians
0.0
/100
|
#291
Tragic
90.3%
Cubans
0.0
/100
|
#292
Tragic
90.2%
Natives/Alaskans
0.0
/100
|
#293
Tragic
90.2%
Immigrants | Grenada
0.0
/100
|
#294
Tragic
90.1%
Immigrants | Vietnam
0.0
/100
|
#295
Tragic
90.0%
Fijians
0.0
/100
|
#296
Tragic
90.0%
Navajo
0.0
/100
|
#297
Tragic
90.0%
Immigrants | Fiji
0.0
/100
|
#298
Tragic
89.9%
Japanese
0.0
/100
|
#299
Tragic
89.9%
Immigrants | Haiti
0.0
/100
|
#300
Tragic
89.9%

Demographics Similar to Immigrants from Jordan by 11th Grade

In terms of 11th grade, the demographic groups most similar to Immigrants from Jordan are Immigrants from Kazakhstan (93.1%, a difference of 0.0%), Immigrants from Ukraine (93.0%, a difference of 0.080%), Albanian (93.0%, a difference of 0.090%), Egyptian (93.0%, a difference of 0.090%), and Immigrants from Bosnia and Herzegovina (93.0%, a difference of 0.10%).
DemographicsRating | Rank11th Grade
German Russians
96.4
/100
|
#121
Exceptional
93.3%
Immigrants | Belarus
96.3
/100
|
#122
Exceptional
93.3%
Immigrants | Greece
95.9
/100
|
#123
Exceptional
93.2%
Immigrants | Eastern Europe
95.9
/100
|
#124
Exceptional
93.2%
Immigrants | Sri Lanka
95.6
/100
|
#125
Exceptional
93.2%
Basques
95.2
/100
|
#126
Exceptional
93.2%
Immigrants | Kazakhstan
92.4
/100
|
#127
Exceptional
93.1%
Immigrants | Jordan
92.4
/100
|
#128
Exceptional
93.1%
Immigrants | Ukraine
89.8
/100
|
#129
Excellent
93.0%
Albanians
89.5
/100
|
#130
Excellent
93.0%
Egyptians
89.5
/100
|
#131
Excellent
93.0%
Immigrants | Bosnia and Herzegovina
89.0
/100
|
#132
Excellent
93.0%
Mongolians
87.6
/100
|
#133
Excellent
93.0%
Delaware
87.3
/100
|
#134
Excellent
93.0%
Immigrants | Italy
86.6
/100
|
#135
Excellent
92.9%