Turkish vs Choctaw 11th Grade
COMPARE
Turkish
Choctaw
11th Grade
11th Grade Comparison
Turks
Choctaw
94.0%
11TH GRADE
99.9/ 100
METRIC RATING
51st/ 347
METRIC RANK
91.8%
11TH GRADE
3.7/ 100
METRIC RATING
231st/ 347
METRIC RANK
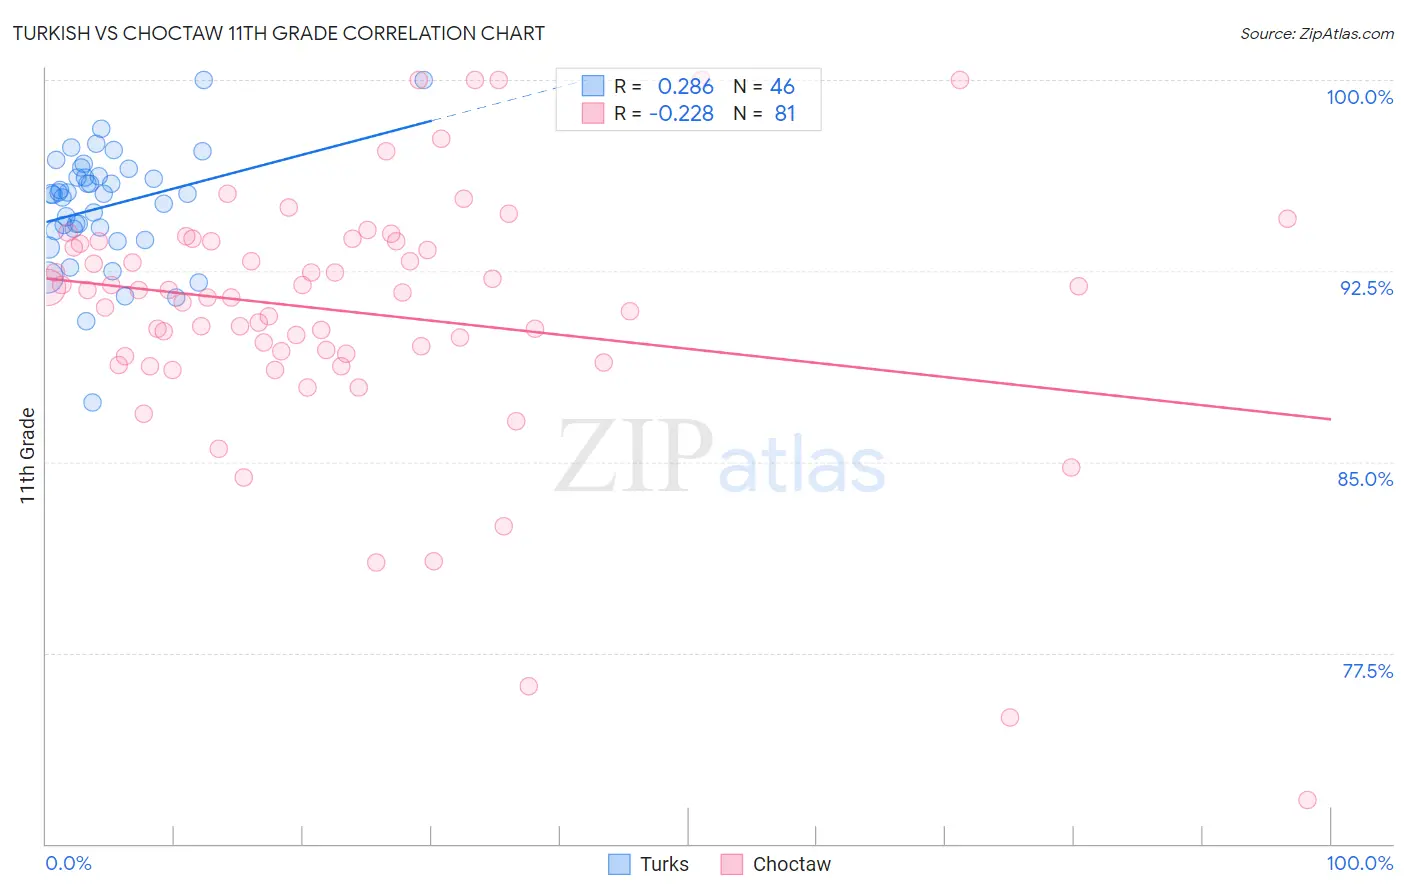
Turkish vs Choctaw 11th Grade Correlation Chart
The statistical analysis conducted on geographies consisting of 271,864,104 people shows a weak positive correlation between the proportion of Turks and percentage of population with at least 11th grade education in the United States with a correlation coefficient (R) of 0.286 and weighted average of 94.0%. Similarly, the statistical analysis conducted on geographies consisting of 269,742,875 people shows a weak negative correlation between the proportion of Choctaw and percentage of population with at least 11th grade education in the United States with a correlation coefficient (R) of -0.228 and weighted average of 91.8%, a difference of 2.5%.
11th Grade Correlation Summary
| Measurement | Turkish | Choctaw |
| Minimum | 87.4% | 71.7% |
| Maximum | 100.0% | 100.0% |
| Range | 12.6% | 28.3% |
| Mean | 95.0% | 90.9% |
| Median | 95.5% | 91.7% |
| Interquartile 25% (IQ1) | 94.1% | 89.2% |
| Interquartile 75% (IQ3) | 96.2% | 93.7% |
| Interquartile Range (IQR) | 2.1% | 4.5% |
| Standard Deviation (Sample) | 2.3% | 5.0% |
| Standard Deviation (Population) | 2.3% | 5.0% |
Similar Demographics by 11th Grade
Demographics Similar to Turks by 11th Grade
In terms of 11th grade, the demographic groups most similar to Turks are Immigrants from Canada (94.0%, a difference of 0.010%), Immigrants from Australia (94.0%, a difference of 0.020%), Filipino (94.1%, a difference of 0.030%), Macedonian (94.1%, a difference of 0.030%), and Slavic (94.1%, a difference of 0.030%).
| Demographics | Rating | Rank | 11th Grade |
| Immigrants | Ireland | 99.9 /100 | #44 | Exceptional 94.1% |
| Australians | 99.9 /100 | #45 | Exceptional 94.1% |
| Serbians | 99.9 /100 | #46 | Exceptional 94.1% |
| Filipinos | 99.9 /100 | #47 | Exceptional 94.1% |
| Macedonians | 99.9 /100 | #48 | Exceptional 94.1% |
| Slavs | 99.9 /100 | #49 | Exceptional 94.1% |
| French | 99.9 /100 | #50 | Exceptional 94.1% |
| Turks | 99.9 /100 | #51 | Exceptional 94.0% |
| Immigrants | Canada | 99.9 /100 | #52 | Exceptional 94.0% |
| Immigrants | Australia | 99.9 /100 | #53 | Exceptional 94.0% |
| Immigrants | North America | 99.9 /100 | #54 | Exceptional 94.0% |
| Czechoslovakians | 99.9 /100 | #55 | Exceptional 94.0% |
| French Canadians | 99.9 /100 | #56 | Exceptional 94.0% |
| New Zealanders | 99.9 /100 | #57 | Exceptional 94.0% |
| Iranians | 99.9 /100 | #58 | Exceptional 94.0% |
Demographics Similar to Choctaw by 11th Grade
In terms of 11th grade, the demographic groups most similar to Choctaw are Immigrants from Afghanistan (91.8%, a difference of 0.010%), Uruguayan (91.8%, a difference of 0.020%), Cheyenne (91.8%, a difference of 0.030%), Immigrants from Cameroon (91.8%, a difference of 0.040%), and Immigrants from Panama (91.8%, a difference of 0.040%).
| Demographics | Rating | Rank | 11th Grade |
| Costa Ricans | 6.3 /100 | #224 | Tragic 91.9% |
| Immigrants | Zaire | 5.4 /100 | #225 | Tragic 91.9% |
| Immigrants | Somalia | 5.2 /100 | #226 | Tragic 91.9% |
| Immigrants | Cameroon | 4.4 /100 | #227 | Tragic 91.8% |
| Immigrants | Panama | 4.3 /100 | #228 | Tragic 91.8% |
| Nigerians | 4.3 /100 | #229 | Tragic 91.8% |
| Immigrants | Afghanistan | 3.9 /100 | #230 | Tragic 91.8% |
| Choctaw | 3.7 /100 | #231 | Tragic 91.8% |
| Uruguayans | 3.5 /100 | #232 | Tragic 91.8% |
| Cheyenne | 3.3 /100 | #233 | Tragic 91.8% |
| Armenians | 2.9 /100 | #234 | Tragic 91.7% |
| Sub-Saharan Africans | 2.9 /100 | #235 | Tragic 91.7% |
| Colombians | 2.8 /100 | #236 | Tragic 91.7% |
| Immigrants | Bolivia | 2.8 /100 | #237 | Tragic 91.7% |
| Comanche | 2.6 /100 | #238 | Tragic 91.7% |