Yaqui vs Immigrants from Jordan 11th Grade
COMPARE
Yaqui
Immigrants from Jordan
11th Grade
11th Grade Comparison
Yaqui
Immigrants from Jordan
89.5%
11TH GRADE
0.0/ 100
METRIC RATING
310th/ 347
METRIC RANK
93.1%
11TH GRADE
92.4/ 100
METRIC RATING
128th/ 347
METRIC RANK
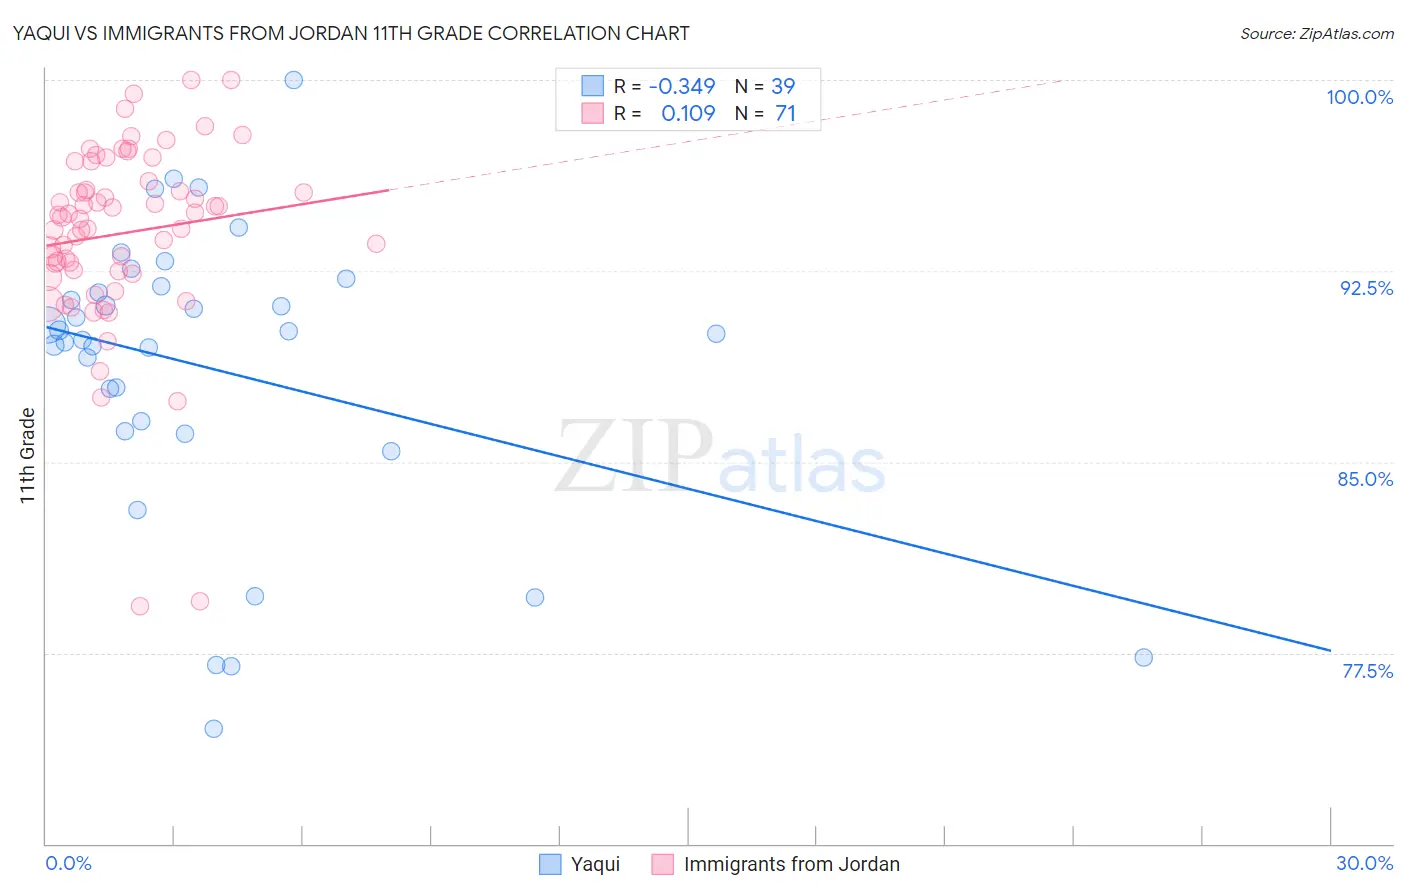
Yaqui vs Immigrants from Jordan 11th Grade Correlation Chart
The statistical analysis conducted on geographies consisting of 107,725,021 people shows a mild negative correlation between the proportion of Yaqui and percentage of population with at least 11th grade education in the United States with a correlation coefficient (R) of -0.349 and weighted average of 89.5%. Similarly, the statistical analysis conducted on geographies consisting of 181,278,272 people shows a poor positive correlation between the proportion of Immigrants from Jordan and percentage of population with at least 11th grade education in the United States with a correlation coefficient (R) of 0.109 and weighted average of 93.1%, a difference of 4.0%.
11th Grade Correlation Summary
| Measurement | Yaqui | Immigrants from Jordan |
| Minimum | 74.5% | 79.3% |
| Maximum | 100.0% | 100.0% |
| Range | 25.5% | 20.7% |
| Mean | 88.7% | 94.0% |
| Median | 90.0% | 94.6% |
| Interquartile 25% (IQ1) | 86.2% | 92.5% |
| Interquartile 75% (IQ3) | 91.9% | 96.0% |
| Interquartile Range (IQR) | 5.7% | 3.5% |
| Standard Deviation (Sample) | 5.8% | 3.7% |
| Standard Deviation (Population) | 5.7% | 3.7% |
Similar Demographics by 11th Grade
Demographics Similar to Yaqui by 11th Grade
In terms of 11th grade, the demographic groups most similar to Yaqui are Immigrants from Bangladesh (89.5%, a difference of 0.010%), Nepalese (89.5%, a difference of 0.030%), Immigrants from Dominica (89.5%, a difference of 0.060%), Vietnamese (89.4%, a difference of 0.060%), and Ecuadorian (89.6%, a difference of 0.11%).
| Demographics | Rating | Rank | 11th Grade |
| Immigrants | Immigrants | 0.0 /100 | #303 | Tragic 89.7% |
| Yuman | 0.0 /100 | #304 | Tragic 89.7% |
| Immigrants | Cambodia | 0.0 /100 | #305 | Tragic 89.6% |
| Ecuadorians | 0.0 /100 | #306 | Tragic 89.6% |
| Immigrants | Dominica | 0.0 /100 | #307 | Tragic 89.5% |
| Nepalese | 0.0 /100 | #308 | Tragic 89.5% |
| Immigrants | Bangladesh | 0.0 /100 | #309 | Tragic 89.5% |
| Yaqui | 0.0 /100 | #310 | Tragic 89.5% |
| Vietnamese | 0.0 /100 | #311 | Tragic 89.4% |
| Immigrants | Portugal | 0.0 /100 | #312 | Tragic 89.3% |
| Immigrants | Caribbean | 0.0 /100 | #313 | Tragic 89.1% |
| Cape Verdeans | 0.0 /100 | #314 | Tragic 89.1% |
| Immigrants | Ecuador | 0.0 /100 | #315 | Tragic 89.1% |
| Immigrants | Cuba | 0.0 /100 | #316 | Tragic 88.9% |
| Lumbee | 0.0 /100 | #317 | Tragic 88.9% |
Demographics Similar to Immigrants from Jordan by 11th Grade
In terms of 11th grade, the demographic groups most similar to Immigrants from Jordan are Immigrants from Kazakhstan (93.1%, a difference of 0.0%), Immigrants from Ukraine (93.0%, a difference of 0.080%), Albanian (93.0%, a difference of 0.090%), Egyptian (93.0%, a difference of 0.090%), and Immigrants from Bosnia and Herzegovina (93.0%, a difference of 0.10%).
| Demographics | Rating | Rank | 11th Grade |
| German Russians | 96.4 /100 | #121 | Exceptional 93.3% |
| Immigrants | Belarus | 96.3 /100 | #122 | Exceptional 93.3% |
| Immigrants | Greece | 95.9 /100 | #123 | Exceptional 93.2% |
| Immigrants | Eastern Europe | 95.9 /100 | #124 | Exceptional 93.2% |
| Immigrants | Sri Lanka | 95.6 /100 | #125 | Exceptional 93.2% |
| Basques | 95.2 /100 | #126 | Exceptional 93.2% |
| Immigrants | Kazakhstan | 92.4 /100 | #127 | Exceptional 93.1% |
| Immigrants | Jordan | 92.4 /100 | #128 | Exceptional 93.1% |
| Immigrants | Ukraine | 89.8 /100 | #129 | Excellent 93.0% |
| Albanians | 89.5 /100 | #130 | Excellent 93.0% |
| Egyptians | 89.5 /100 | #131 | Excellent 93.0% |
| Immigrants | Bosnia and Herzegovina | 89.0 /100 | #132 | Excellent 93.0% |
| Mongolians | 87.6 /100 | #133 | Excellent 93.0% |
| Delaware | 87.3 /100 | #134 | Excellent 93.0% |
| Immigrants | Italy | 86.6 /100 | #135 | Excellent 92.9% |