Immigrants from South America vs Cree Associate's Degree
COMPARE
Immigrants from South America
Cree
Associate's Degree
Associate's Degree Comparison
Immigrants from South America
Cree
46.7%
ASSOCIATE'S DEGREE
59.9/ 100
METRIC RATING
165th/ 347
METRIC RANK
42.5%
ASSOCIATE'S DEGREE
1.2/ 100
METRIC RATING
240th/ 347
METRIC RANK
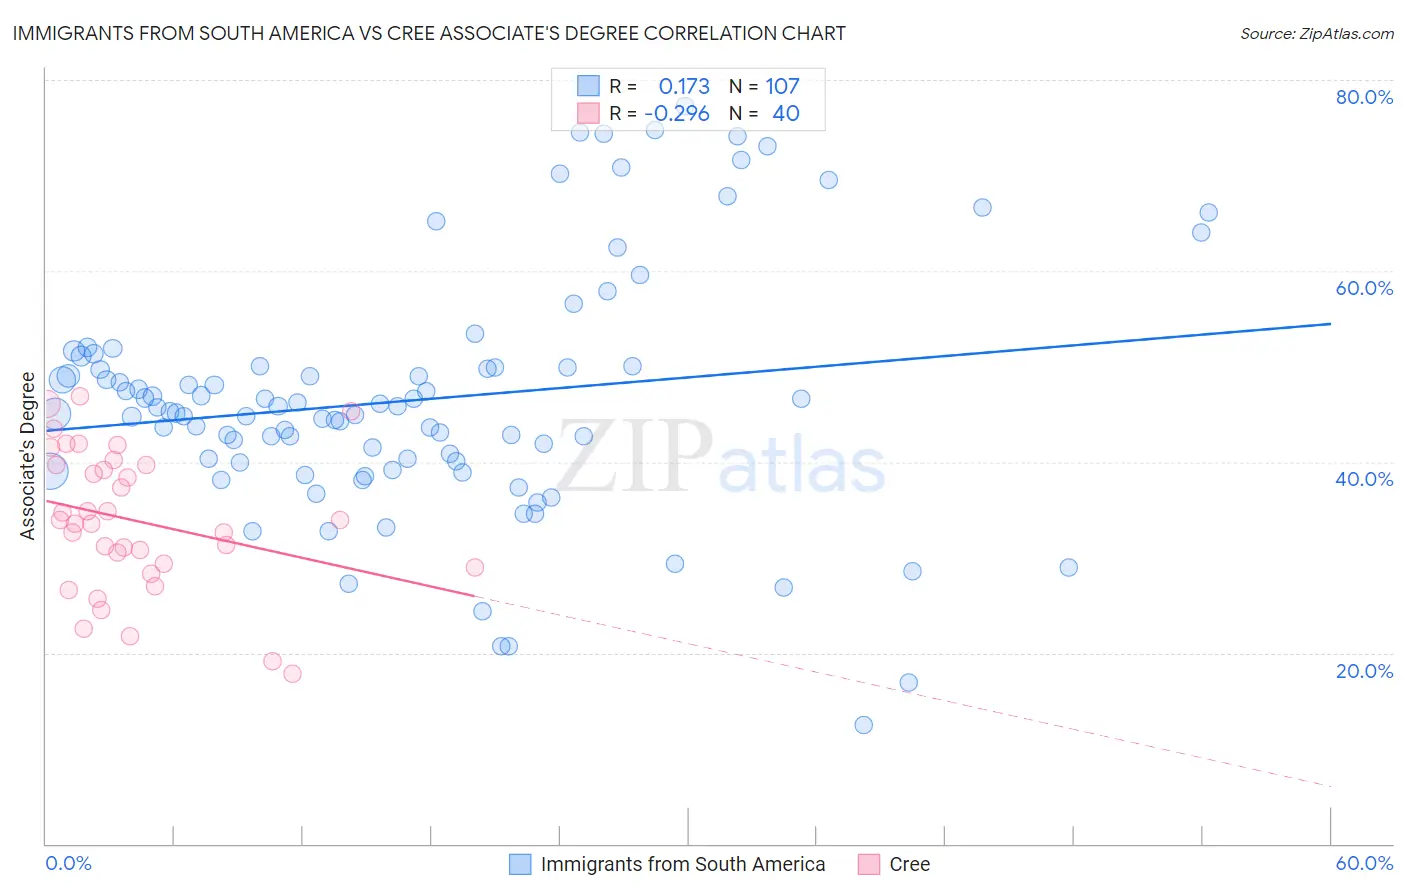
Immigrants from South America vs Cree Associate's Degree Correlation Chart
The statistical analysis conducted on geographies consisting of 486,384,317 people shows a poor positive correlation between the proportion of Immigrants from South America and percentage of population with at least associate's degree education in the United States with a correlation coefficient (R) of 0.173 and weighted average of 46.7%. Similarly, the statistical analysis conducted on geographies consisting of 76,211,414 people shows a weak negative correlation between the proportion of Cree and percentage of population with at least associate's degree education in the United States with a correlation coefficient (R) of -0.296 and weighted average of 42.5%, a difference of 9.8%.
Associate's Degree Correlation Summary
| Measurement | Immigrants from South America | Cree |
| Minimum | 12.4% | 17.8% |
| Maximum | 77.3% | 46.9% |
| Range | 64.9% | 29.1% |
| Mean | 46.5% | 33.8% |
| Median | 45.2% | 33.7% |
| Interquartile 25% (IQ1) | 40.0% | 29.1% |
| Interquartile 75% (IQ3) | 50.0% | 39.6% |
| Interquartile Range (IQR) | 10.0% | 10.6% |
| Standard Deviation (Sample) | 12.9% | 7.4% |
| Standard Deviation (Population) | 12.8% | 7.3% |
Similar Demographics by Associate's Degree
Demographics Similar to Immigrants from South America by Associate's Degree
In terms of associate's degree, the demographic groups most similar to Immigrants from South America are Hungarian (46.7%, a difference of 0.040%), Immigrants from Sierra Leone (46.7%, a difference of 0.050%), Colombian (46.8%, a difference of 0.20%), Somali (46.8%, a difference of 0.21%), and Immigrants from Africa (46.8%, a difference of 0.26%).
| Demographics | Rating | Rank | Associate's Degree |
| Immigrants | Germany | 69.7 /100 | #158 | Good 47.1% |
| Immigrants | Poland | 69.2 /100 | #159 | Good 47.1% |
| Scottish | 65.4 /100 | #160 | Good 46.9% |
| Scandinavians | 65.2 /100 | #161 | Good 46.9% |
| Immigrants | Africa | 63.2 /100 | #162 | Good 46.8% |
| Somalis | 62.5 /100 | #163 | Good 46.8% |
| Colombians | 62.4 /100 | #164 | Good 46.8% |
| Immigrants | South America | 59.9 /100 | #165 | Average 46.7% |
| Hungarians | 59.3 /100 | #166 | Average 46.7% |
| Immigrants | Sierra Leone | 59.2 /100 | #167 | Average 46.7% |
| Immigrants | Somalia | 55.5 /100 | #168 | Average 46.5% |
| Uruguayans | 55.4 /100 | #169 | Average 46.5% |
| Irish | 53.6 /100 | #170 | Average 46.5% |
| Basques | 52.8 /100 | #171 | Average 46.5% |
| Peruvians | 50.5 /100 | #172 | Average 46.4% |
Demographics Similar to Cree by Associate's Degree
In terms of associate's degree, the demographic groups most similar to Cree are Immigrants from Grenada (42.6%, a difference of 0.18%), British West Indian (42.4%, a difference of 0.33%), Immigrants from West Indies (42.4%, a difference of 0.34%), Guyanese (42.3%, a difference of 0.45%), and Immigrants from Liberia (42.3%, a difference of 0.59%).
| Demographics | Rating | Rank | Associate's Degree |
| Tongans | 2.2 /100 | #233 | Tragic 43.0% |
| Tlingit-Haida | 2.1 /100 | #234 | Tragic 43.0% |
| Ecuadorians | 2.0 /100 | #235 | Tragic 43.0% |
| Immigrants | St. Vincent and the Grenadines | 1.9 /100 | #236 | Tragic 42.9% |
| Immigrants | Nonimmigrants | 1.9 /100 | #237 | Tragic 42.9% |
| Iroquois | 1.7 /100 | #238 | Tragic 42.8% |
| Immigrants | Grenada | 1.3 /100 | #239 | Tragic 42.6% |
| Cree | 1.2 /100 | #240 | Tragic 42.5% |
| British West Indians | 1.0 /100 | #241 | Tragic 42.4% |
| Immigrants | West Indies | 1.0 /100 | #242 | Tragic 42.4% |
| Guyanese | 1.0 /100 | #243 | Tragic 42.3% |
| Immigrants | Liberia | 0.9 /100 | #244 | Tragic 42.3% |
| Immigrants | Cambodia | 0.9 /100 | #245 | Tragic 42.3% |
| Delaware | 0.9 /100 | #246 | Tragic 42.3% |
| Immigrants | Fiji | 0.8 /100 | #247 | Tragic 42.2% |