French vs Cree Associate's Degree
COMPARE
French
Cree
Associate's Degree
Associate's Degree Comparison
French
Cree
45.4%
ASSOCIATE'S DEGREE
25.6/ 100
METRIC RATING
196th/ 347
METRIC RANK
42.5%
ASSOCIATE'S DEGREE
1.2/ 100
METRIC RATING
240th/ 347
METRIC RANK
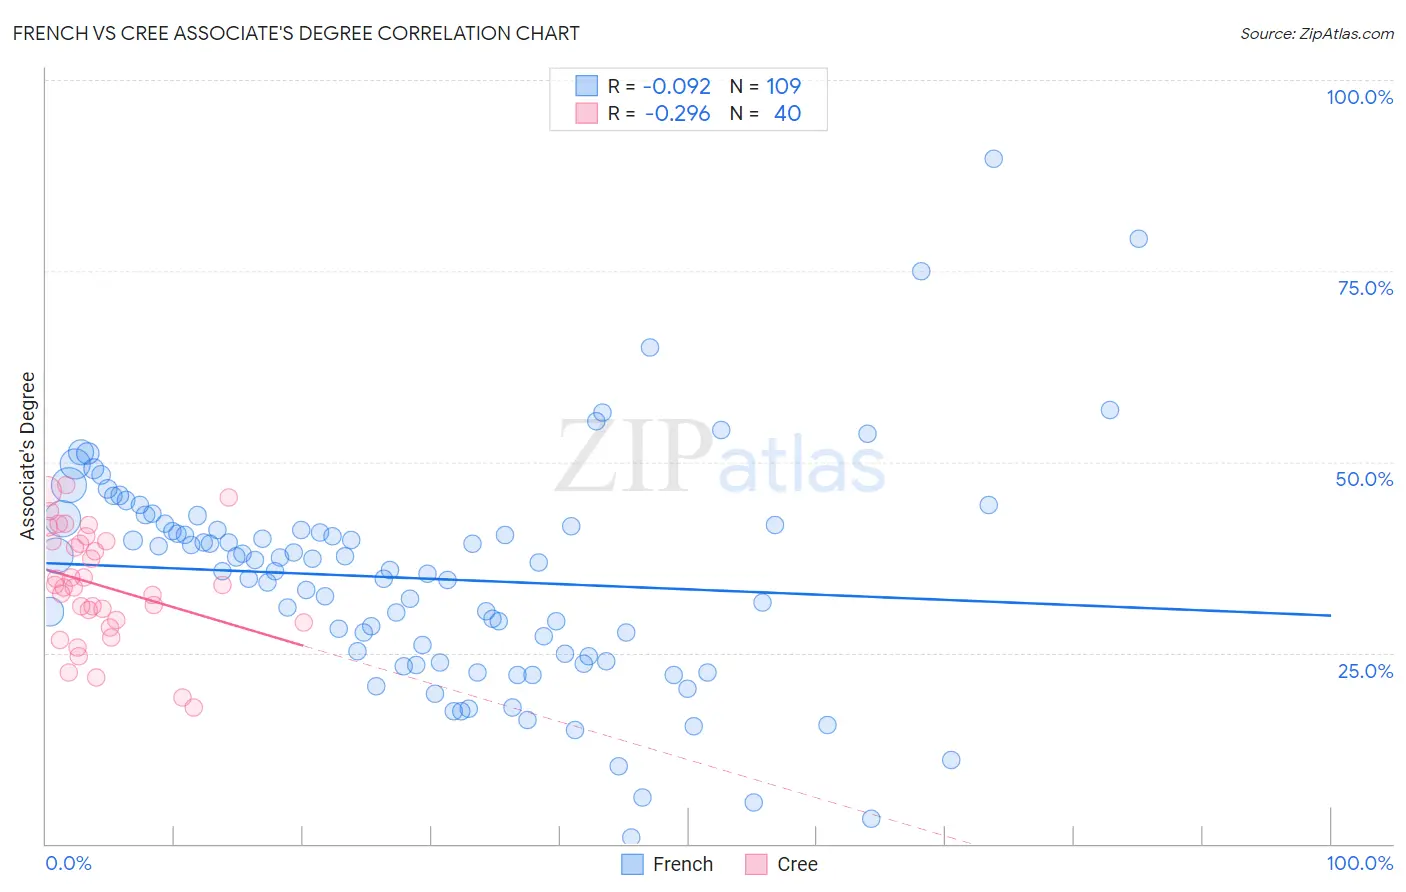
French vs Cree Associate's Degree Correlation Chart
The statistical analysis conducted on geographies consisting of 572,343,340 people shows a slight negative correlation between the proportion of French and percentage of population with at least associate's degree education in the United States with a correlation coefficient (R) of -0.092 and weighted average of 45.4%. Similarly, the statistical analysis conducted on geographies consisting of 76,211,414 people shows a weak negative correlation between the proportion of Cree and percentage of population with at least associate's degree education in the United States with a correlation coefficient (R) of -0.296 and weighted average of 42.5%, a difference of 6.8%.
Associate's Degree Correlation Summary
| Measurement | French | Cree |
| Minimum | 0.78% | 17.8% |
| Maximum | 89.7% | 46.9% |
| Range | 88.9% | 29.1% |
| Mean | 34.7% | 33.8% |
| Median | 35.9% | 33.7% |
| Interquartile 25% (IQ1) | 24.2% | 29.1% |
| Interquartile 75% (IQ3) | 41.7% | 39.6% |
| Interquartile Range (IQR) | 17.5% | 10.6% |
| Standard Deviation (Sample) | 14.6% | 7.4% |
| Standard Deviation (Population) | 14.6% | 7.3% |
Similar Demographics by Associate's Degree
Demographics Similar to French by Associate's Degree
In terms of associate's degree, the demographic groups most similar to French are German (45.5%, a difference of 0.090%), Immigrants from Peru (45.5%, a difference of 0.19%), Scotch-Irish (45.3%, a difference of 0.35%), Immigrants from Bangladesh (45.2%, a difference of 0.45%), and Immigrants from Senegal (45.2%, a difference of 0.47%).
| Demographics | Rating | Rank | Associate's Degree |
| Immigrants | Oceania | 34.7 /100 | #189 | Fair 45.8% |
| Vietnamese | 34.0 /100 | #190 | Fair 45.8% |
| Koreans | 33.8 /100 | #191 | Fair 45.8% |
| Celtics | 33.3 /100 | #192 | Fair 45.8% |
| Immigrants | Cameroon | 31.0 /100 | #193 | Fair 45.7% |
| Immigrants | Peru | 27.6 /100 | #194 | Fair 45.5% |
| Germans | 26.5 /100 | #195 | Fair 45.5% |
| French | 25.6 /100 | #196 | Fair 45.4% |
| Scotch-Irish | 22.3 /100 | #197 | Fair 45.3% |
| Immigrants | Bangladesh | 21.3 /100 | #198 | Fair 45.2% |
| Immigrants | Senegal | 21.2 /100 | #199 | Fair 45.2% |
| Senegalese | 21.1 /100 | #200 | Fair 45.2% |
| Immigrants | Vietnam | 20.8 /100 | #201 | Fair 45.2% |
| Spaniards | 20.4 /100 | #202 | Fair 45.2% |
| Immigrants | South Eastern Asia | 20.2 /100 | #203 | Fair 45.2% |
Demographics Similar to Cree by Associate's Degree
In terms of associate's degree, the demographic groups most similar to Cree are Immigrants from Grenada (42.6%, a difference of 0.18%), British West Indian (42.4%, a difference of 0.33%), Immigrants from West Indies (42.4%, a difference of 0.34%), Guyanese (42.3%, a difference of 0.45%), and Immigrants from Liberia (42.3%, a difference of 0.59%).
| Demographics | Rating | Rank | Associate's Degree |
| Tongans | 2.2 /100 | #233 | Tragic 43.0% |
| Tlingit-Haida | 2.1 /100 | #234 | Tragic 43.0% |
| Ecuadorians | 2.0 /100 | #235 | Tragic 43.0% |
| Immigrants | St. Vincent and the Grenadines | 1.9 /100 | #236 | Tragic 42.9% |
| Immigrants | Nonimmigrants | 1.9 /100 | #237 | Tragic 42.9% |
| Iroquois | 1.7 /100 | #238 | Tragic 42.8% |
| Immigrants | Grenada | 1.3 /100 | #239 | Tragic 42.6% |
| Cree | 1.2 /100 | #240 | Tragic 42.5% |
| British West Indians | 1.0 /100 | #241 | Tragic 42.4% |
| Immigrants | West Indies | 1.0 /100 | #242 | Tragic 42.4% |
| Guyanese | 1.0 /100 | #243 | Tragic 42.3% |
| Immigrants | Liberia | 0.9 /100 | #244 | Tragic 42.3% |
| Immigrants | Cambodia | 0.9 /100 | #245 | Tragic 42.3% |
| Delaware | 0.9 /100 | #246 | Tragic 42.3% |
| Immigrants | Fiji | 0.8 /100 | #247 | Tragic 42.2% |