Tsimshian vs Cape Verdean Professional Degree
COMPARE
Tsimshian
Cape Verdean
Professional Degree
Professional Degree Comparison
Tsimshian
Cape Verdeans
3.2%
PROFESSIONAL DEGREE
0.0/ 100
METRIC RATING
321st/ 347
METRIC RANK
3.4%
PROFESSIONAL DEGREE
0.1/ 100
METRIC RATING
306th/ 347
METRIC RANK
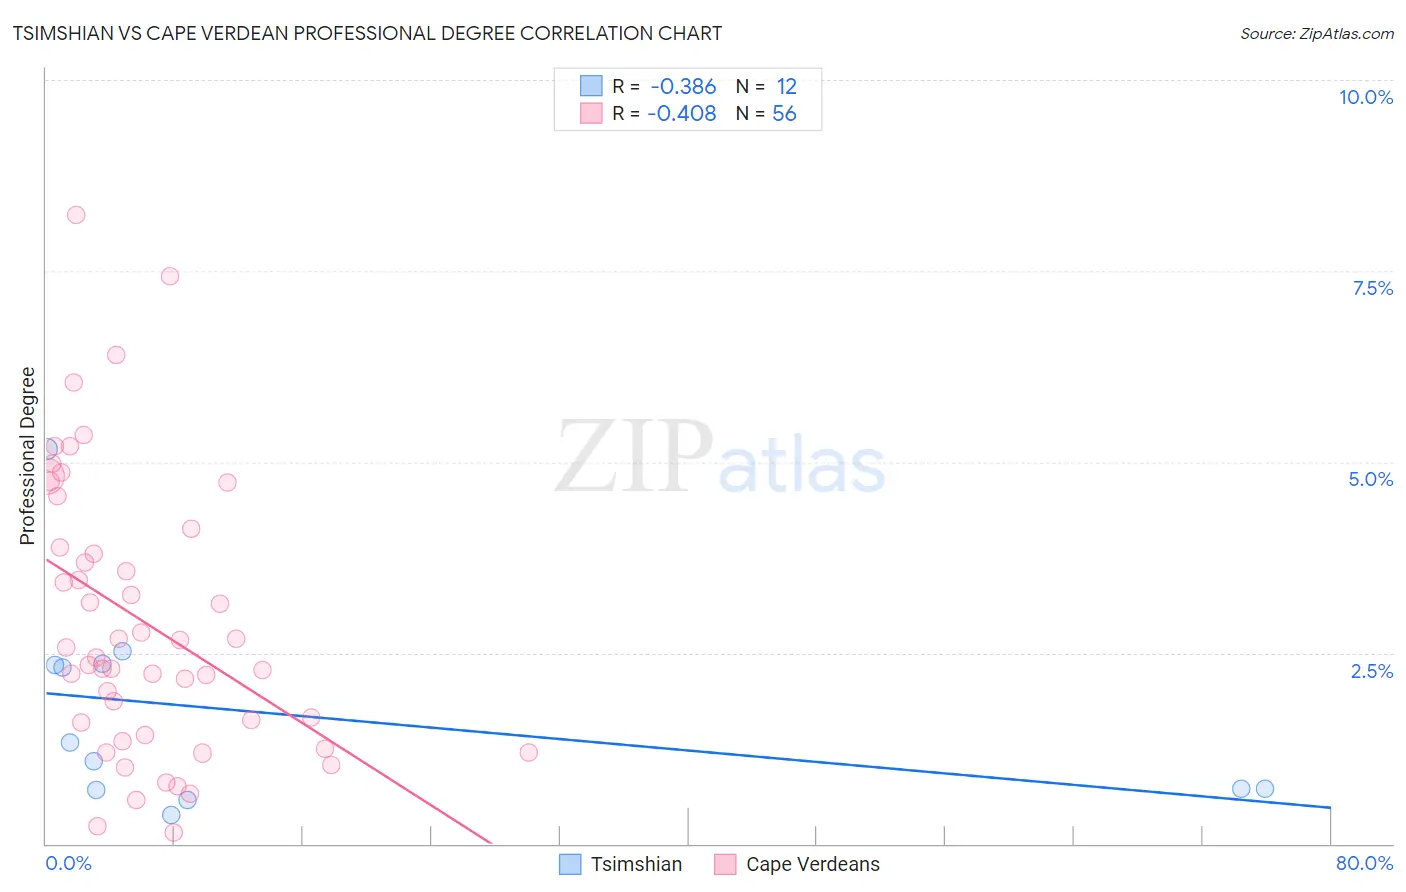
Tsimshian vs Cape Verdean Professional Degree Correlation Chart
The statistical analysis conducted on geographies consisting of 15,614,727 people shows a mild negative correlation between the proportion of Tsimshian and percentage of population with at least professional degree education in the United States with a correlation coefficient (R) of -0.386 and weighted average of 3.2%. Similarly, the statistical analysis conducted on geographies consisting of 107,527,717 people shows a moderate negative correlation between the proportion of Cape Verdeans and percentage of population with at least professional degree education in the United States with a correlation coefficient (R) of -0.408 and weighted average of 3.4%, a difference of 5.7%.
Professional Degree Correlation Summary
| Measurement | Tsimshian | Cape Verdean |
| Minimum | 0.38% | 0.14% |
| Maximum | 5.2% | 8.2% |
| Range | 4.8% | 8.1% |
| Mean | 1.7% | 2.9% |
| Median | 1.2% | 2.5% |
| Interquartile 25% (IQ1) | 0.71% | 1.5% |
| Interquartile 75% (IQ3) | 2.4% | 4.0% |
| Interquartile Range (IQR) | 1.6% | 2.5% |
| Standard Deviation (Sample) | 1.4% | 1.8% |
| Standard Deviation (Population) | 1.3% | 1.8% |
Demographics Similar to Tsimshian and Cape Verdeans by Professional Degree
In terms of professional degree, the demographic groups most similar to Tsimshian are Seminole (3.2%, a difference of 0.36%), Hispanic or Latino (3.2%, a difference of 0.36%), Inupiat (3.2%, a difference of 0.44%), Choctaw (3.2%, a difference of 1.5%), and Immigrants from Micronesia (3.2%, a difference of 1.8%). Similarly, the demographic groups most similar to Cape Verdeans are Chickasaw (3.4%, a difference of 0.010%), Cajun (3.4%, a difference of 0.31%), Immigrants from Haiti (3.4%, a difference of 0.32%), Samoan (3.3%, a difference of 1.1%), and Shoshone (3.3%, a difference of 1.6%).
| Demographics | Rating | Rank | Professional Degree |
| Immigrants | Haiti | 0.2 /100 | #303 | Tragic 3.4% |
| Cajuns | 0.2 /100 | #304 | Tragic 3.4% |
| Chickasaw | 0.1 /100 | #305 | Tragic 3.4% |
| Cape Verdeans | 0.1 /100 | #306 | Tragic 3.4% |
| Samoans | 0.1 /100 | #307 | Tragic 3.3% |
| Shoshone | 0.1 /100 | #308 | Tragic 3.3% |
| Pima | 0.1 /100 | #309 | Tragic 3.3% |
| Immigrants | Latin America | 0.1 /100 | #310 | Tragic 3.3% |
| Cherokee | 0.1 /100 | #311 | Tragic 3.3% |
| Sioux | 0.1 /100 | #312 | Tragic 3.3% |
| Yuman | 0.1 /100 | #313 | Tragic 3.3% |
| Mexican American Indians | 0.1 /100 | #314 | Tragic 3.3% |
| Immigrants | Laos | 0.1 /100 | #315 | Tragic 3.2% |
| Puerto Ricans | 0.1 /100 | #316 | Tragic 3.2% |
| Nepalese | 0.1 /100 | #317 | Tragic 3.2% |
| Immigrants | Micronesia | 0.1 /100 | #318 | Tragic 3.2% |
| Choctaw | 0.1 /100 | #319 | Tragic 3.2% |
| Seminole | 0.1 /100 | #320 | Tragic 3.2% |
| Tsimshian | 0.0 /100 | #321 | Tragic 3.2% |
| Hispanics or Latinos | 0.0 /100 | #322 | Tragic 3.2% |
| Inupiat | 0.0 /100 | #323 | Tragic 3.2% |