Tsimshian vs New Zealander Professional Degree
COMPARE
Tsimshian
New Zealander
Professional Degree
Professional Degree Comparison
Tsimshian
New Zealanders
3.2%
PROFESSIONAL DEGREE
0.0/ 100
METRIC RATING
321st/ 347
METRIC RANK
6.0%
PROFESSIONAL DEGREE
100.0/ 100
METRIC RATING
41st/ 347
METRIC RANK
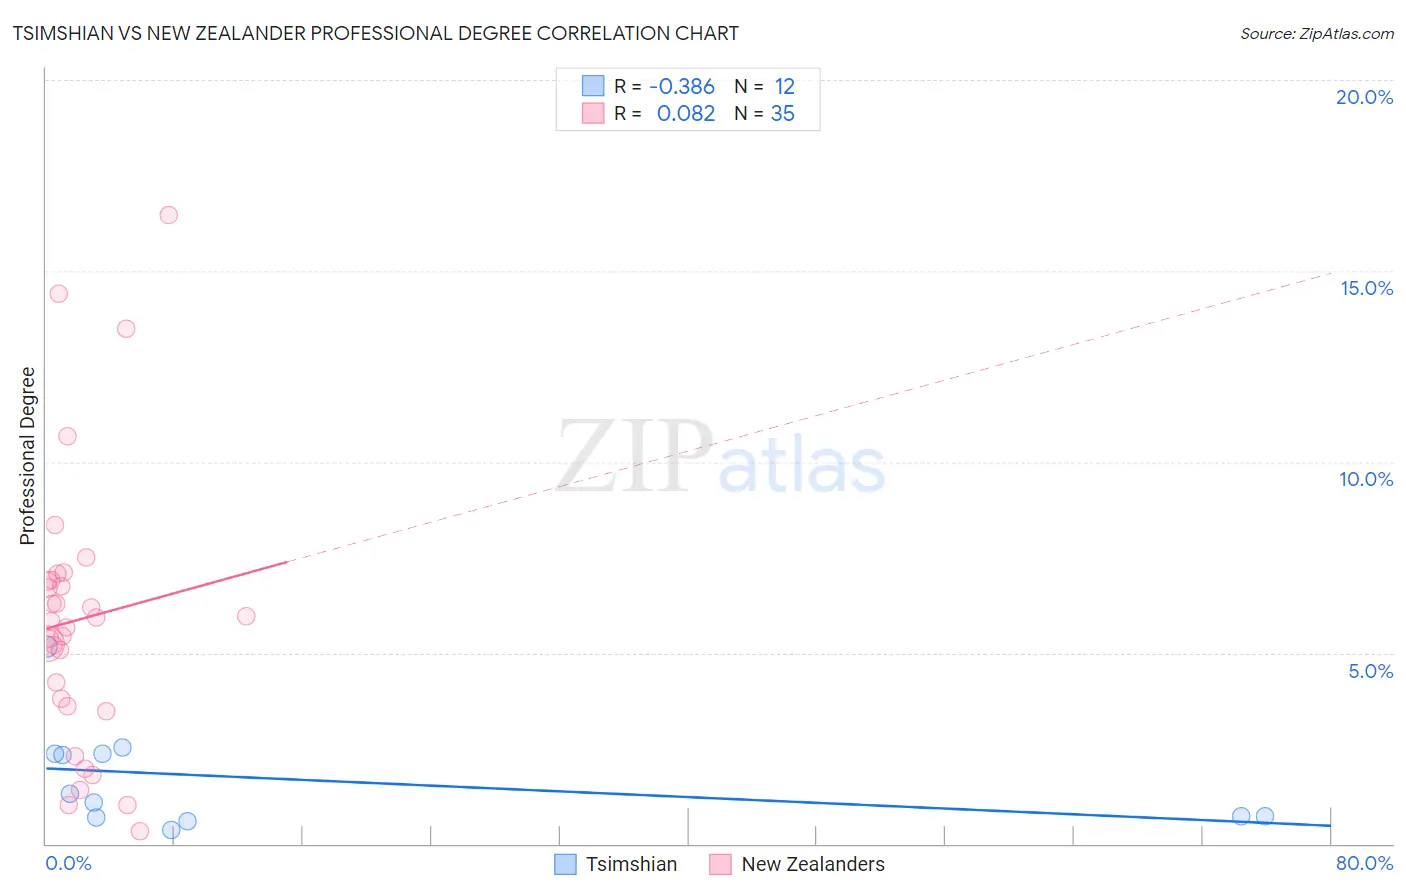
Tsimshian vs New Zealander Professional Degree Correlation Chart
The statistical analysis conducted on geographies consisting of 15,614,727 people shows a mild negative correlation between the proportion of Tsimshian and percentage of population with at least professional degree education in the United States with a correlation coefficient (R) of -0.386 and weighted average of 3.2%. Similarly, the statistical analysis conducted on geographies consisting of 106,863,101 people shows a slight positive correlation between the proportion of New Zealanders and percentage of population with at least professional degree education in the United States with a correlation coefficient (R) of 0.082 and weighted average of 6.0%, a difference of 87.2%.
Professional Degree Correlation Summary
| Measurement | Tsimshian | New Zealander |
| Minimum | 0.38% | 0.31% |
| Maximum | 5.2% | 16.5% |
| Range | 4.8% | 16.1% |
| Mean | 1.7% | 5.9% |
| Median | 1.2% | 5.8% |
| Interquartile 25% (IQ1) | 0.71% | 3.6% |
| Interquartile 75% (IQ3) | 2.4% | 6.9% |
| Interquartile Range (IQR) | 1.6% | 3.3% |
| Standard Deviation (Sample) | 1.4% | 3.6% |
| Standard Deviation (Population) | 1.3% | 3.6% |
Similar Demographics by Professional Degree
Demographics Similar to Tsimshian by Professional Degree
In terms of professional degree, the demographic groups most similar to Tsimshian are Seminole (3.2%, a difference of 0.36%), Hispanic or Latino (3.2%, a difference of 0.36%), Inupiat (3.2%, a difference of 0.44%), Crow (3.2%, a difference of 0.72%), and Yaqui (3.2%, a difference of 0.78%).
| Demographics | Rating | Rank | Professional Degree |
| Mexican American Indians | 0.1 /100 | #314 | Tragic 3.3% |
| Immigrants | Laos | 0.1 /100 | #315 | Tragic 3.2% |
| Puerto Ricans | 0.1 /100 | #316 | Tragic 3.2% |
| Nepalese | 0.1 /100 | #317 | Tragic 3.2% |
| Immigrants | Micronesia | 0.1 /100 | #318 | Tragic 3.2% |
| Choctaw | 0.1 /100 | #319 | Tragic 3.2% |
| Seminole | 0.1 /100 | #320 | Tragic 3.2% |
| Tsimshian | 0.0 /100 | #321 | Tragic 3.2% |
| Hispanics or Latinos | 0.0 /100 | #322 | Tragic 3.2% |
| Inupiat | 0.0 /100 | #323 | Tragic 3.2% |
| Crow | 0.0 /100 | #324 | Tragic 3.2% |
| Yaqui | 0.0 /100 | #325 | Tragic 3.2% |
| Menominee | 0.0 /100 | #326 | Tragic 3.1% |
| Dutch West Indians | 0.0 /100 | #327 | Tragic 3.1% |
| Creek | 0.0 /100 | #328 | Tragic 3.1% |
Demographics Similar to New Zealanders by Professional Degree
In terms of professional degree, the demographic groups most similar to New Zealanders are Estonian (6.0%, a difference of 0.010%), Cambodian (6.0%, a difference of 0.18%), Immigrants from Saudi Arabia (5.9%, a difference of 0.33%), Argentinean (5.9%, a difference of 0.49%), and Immigrants from South Africa (6.0%, a difference of 0.66%).
| Demographics | Rating | Rank | Professional Degree |
| Mongolians | 100.0 /100 | #34 | Exceptional 6.1% |
| Immigrants | Korea | 100.0 /100 | #35 | Exceptional 6.1% |
| Immigrants | Russia | 100.0 /100 | #36 | Exceptional 6.0% |
| Immigrants | Austria | 100.0 /100 | #37 | Exceptional 6.0% |
| Immigrants | Norway | 100.0 /100 | #38 | Exceptional 6.0% |
| Immigrants | South Africa | 100.0 /100 | #39 | Exceptional 6.0% |
| Cambodians | 100.0 /100 | #40 | Exceptional 6.0% |
| New Zealanders | 100.0 /100 | #41 | Exceptional 6.0% |
| Estonians | 100.0 /100 | #42 | Exceptional 6.0% |
| Immigrants | Saudi Arabia | 100.0 /100 | #43 | Exceptional 5.9% |
| Argentineans | 100.0 /100 | #44 | Exceptional 5.9% |
| Immigrants | South Central Asia | 100.0 /100 | #45 | Exceptional 5.9% |
| Immigrants | Argentina | 100.0 /100 | #46 | Exceptional 5.9% |
| Australians | 100.0 /100 | #47 | Exceptional 5.9% |
| Paraguayans | 100.0 /100 | #48 | Exceptional 5.9% |