Immigrants from Bolivia vs Fijian Professional Degree
COMPARE
Immigrants from Bolivia
Fijian
Professional Degree
Professional Degree Comparison
Immigrants from Bolivia
Fijians
5.5%
PROFESSIONAL DEGREE
99.9/ 100
METRIC RATING
65th/ 347
METRIC RANK
2.9%
PROFESSIONAL DEGREE
0.0/ 100
METRIC RATING
336th/ 347
METRIC RANK
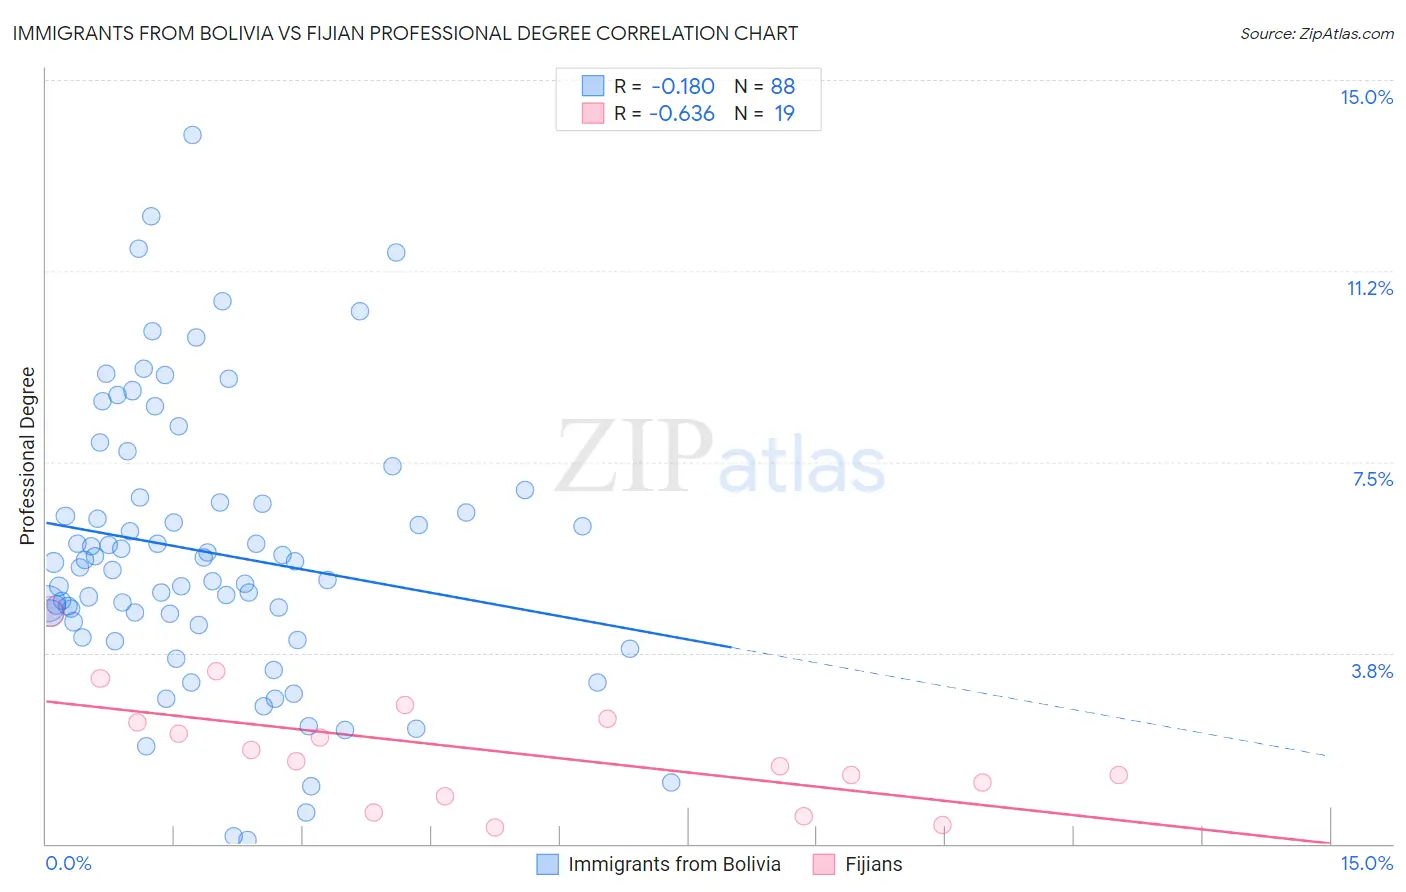
Immigrants from Bolivia vs Fijian Professional Degree Correlation Chart
The statistical analysis conducted on geographies consisting of 158,681,411 people shows a poor negative correlation between the proportion of Immigrants from Bolivia and percentage of population with at least professional degree education in the United States with a correlation coefficient (R) of -0.180 and weighted average of 5.5%. Similarly, the statistical analysis conducted on geographies consisting of 55,894,250 people shows a significant negative correlation between the proportion of Fijians and percentage of population with at least professional degree education in the United States with a correlation coefficient (R) of -0.636 and weighted average of 2.9%, a difference of 88.0%.
Professional Degree Correlation Summary
| Measurement | Immigrants from Bolivia | Fijian |
| Minimum | 0.081% | 0.32% |
| Maximum | 13.9% | 4.6% |
| Range | 13.8% | 4.2% |
| Mean | 5.7% | 1.8% |
| Median | 5.5% | 1.6% |
| Interquartile 25% (IQ1) | 4.3% | 0.93% |
| Interquartile 75% (IQ3) | 6.7% | 2.4% |
| Interquartile Range (IQR) | 2.4% | 1.5% |
| Standard Deviation (Sample) | 2.7% | 1.1% |
| Standard Deviation (Population) | 2.7% | 1.1% |
Similar Demographics by Professional Degree
Demographics Similar to Immigrants from Bolivia by Professional Degree
In terms of professional degree, the demographic groups most similar to Immigrants from Bolivia are Immigrants from Asia (5.5%, a difference of 0.060%), Asian (5.5%, a difference of 0.13%), Immigrants from Kazakhstan (5.5%, a difference of 0.24%), Immigrants from Belarus (5.5%, a difference of 0.56%), and Immigrants from Bulgaria (5.5%, a difference of 0.56%).
| Demographics | Rating | Rank | Professional Degree |
| Bulgarians | 100.0 /100 | #58 | Exceptional 5.7% |
| Immigrants | Europe | 100.0 /100 | #59 | Exceptional 5.6% |
| Bolivians | 99.9 /100 | #60 | Exceptional 5.6% |
| Immigrants | Lithuania | 99.9 /100 | #61 | Exceptional 5.6% |
| Immigrants | Belarus | 99.9 /100 | #62 | Exceptional 5.5% |
| Asians | 99.9 /100 | #63 | Exceptional 5.5% |
| Immigrants | Asia | 99.9 /100 | #64 | Exceptional 5.5% |
| Immigrants | Bolivia | 99.9 /100 | #65 | Exceptional 5.5% |
| Immigrants | Kazakhstan | 99.9 /100 | #66 | Exceptional 5.5% |
| Immigrants | Bulgaria | 99.9 /100 | #67 | Exceptional 5.5% |
| Immigrants | Lebanon | 99.9 /100 | #68 | Exceptional 5.5% |
| Immigrants | Hungary | 99.9 /100 | #69 | Exceptional 5.5% |
| Bhutanese | 99.8 /100 | #70 | Exceptional 5.4% |
| Immigrants | Western Asia | 99.8 /100 | #71 | Exceptional 5.4% |
| Lithuanians | 99.8 /100 | #72 | Exceptional 5.4% |
Demographics Similar to Fijians by Professional Degree
In terms of professional degree, the demographic groups most similar to Fijians are Native/Alaskan (3.0%, a difference of 1.0%), Pennsylvania German (3.0%, a difference of 1.6%), Arapaho (2.9%, a difference of 1.8%), Navajo (2.9%, a difference of 1.9%), and Immigrants from Central America (2.9%, a difference of 2.0%).
| Demographics | Rating | Rank | Professional Degree |
| Bangladeshis | 0.0 /100 | #329 | Tragic 3.1% |
| Immigrants | Cabo Verde | 0.0 /100 | #330 | Tragic 3.1% |
| Kiowa | 0.0 /100 | #331 | Tragic 3.1% |
| Yakama | 0.0 /100 | #332 | Tragic 3.1% |
| Puget Sound Salish | 0.0 /100 | #333 | Tragic 3.1% |
| Pennsylvania Germans | 0.0 /100 | #334 | Tragic 3.0% |
| Natives/Alaskans | 0.0 /100 | #335 | Tragic 3.0% |
| Fijians | 0.0 /100 | #336 | Tragic 2.9% |
| Arapaho | 0.0 /100 | #337 | Tragic 2.9% |
| Navajo | 0.0 /100 | #338 | Tragic 2.9% |
| Immigrants | Central America | 0.0 /100 | #339 | Tragic 2.9% |
| Yup'ik | 0.0 /100 | #340 | Tragic 2.9% |
| Tohono O'odham | 0.0 /100 | #341 | Tragic 2.8% |
| Immigrants | Azores | 0.0 /100 | #342 | Tragic 2.8% |
| Mexicans | 0.0 /100 | #343 | Tragic 2.7% |