Liberian vs Fijian Professional Degree
COMPARE
Liberian
Fijian
Professional Degree
Professional Degree Comparison
Liberians
Fijians
3.6%
PROFESSIONAL DEGREE
0.5/ 100
METRIC RATING
276th/ 347
METRIC RANK
2.9%
PROFESSIONAL DEGREE
0.0/ 100
METRIC RATING
336th/ 347
METRIC RANK
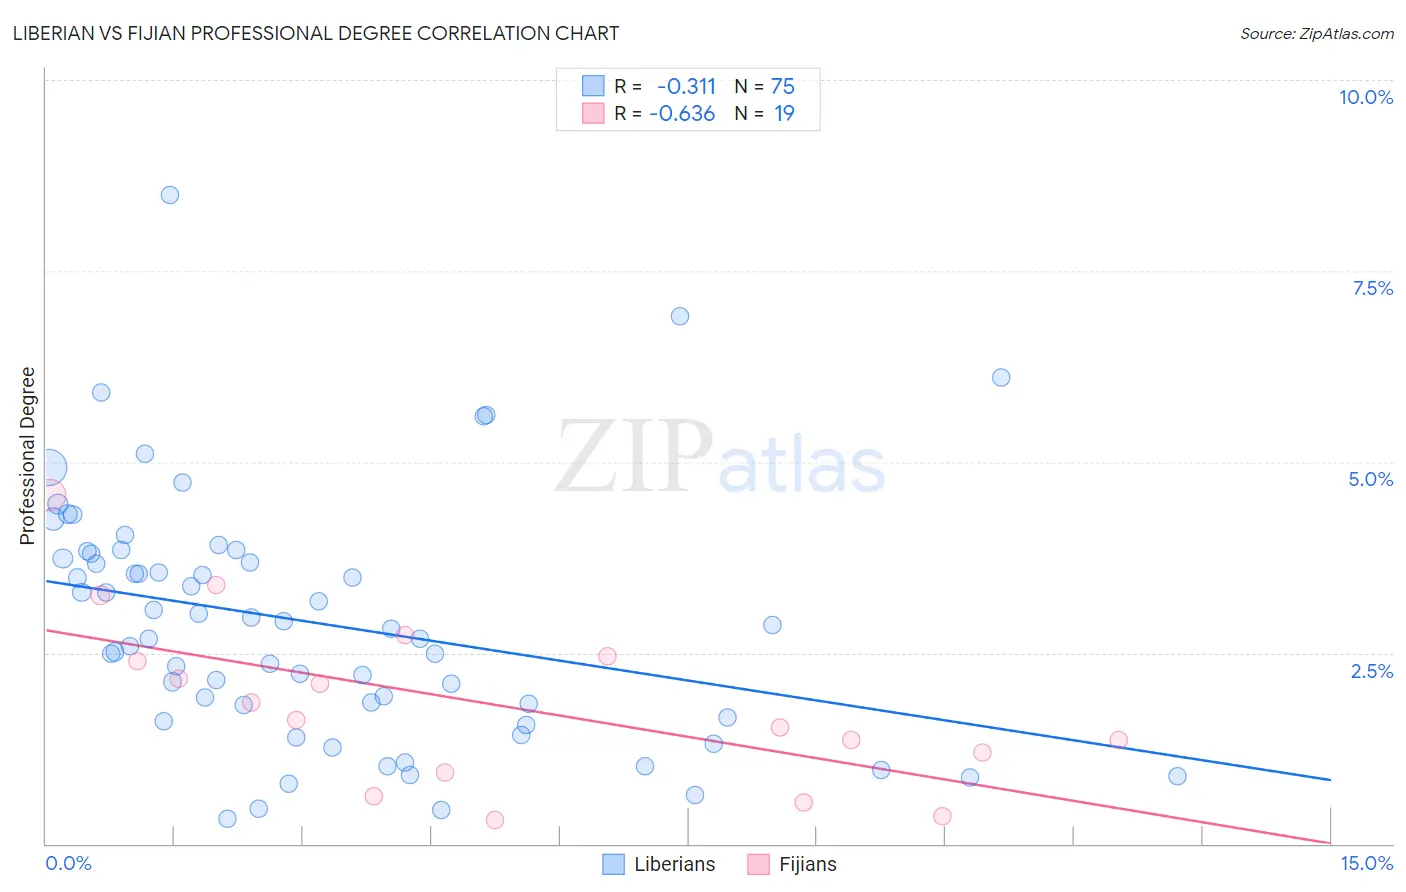
Liberian vs Fijian Professional Degree Correlation Chart
The statistical analysis conducted on geographies consisting of 117,941,180 people shows a mild negative correlation between the proportion of Liberians and percentage of population with at least professional degree education in the United States with a correlation coefficient (R) of -0.311 and weighted average of 3.6%. Similarly, the statistical analysis conducted on geographies consisting of 55,894,250 people shows a significant negative correlation between the proportion of Fijians and percentage of population with at least professional degree education in the United States with a correlation coefficient (R) of -0.636 and weighted average of 2.9%, a difference of 21.3%.
Professional Degree Correlation Summary
| Measurement | Liberian | Fijian |
| Minimum | 0.33% | 0.32% |
| Maximum | 8.5% | 4.6% |
| Range | 8.2% | 4.2% |
| Mean | 2.9% | 1.8% |
| Median | 2.8% | 1.6% |
| Interquartile 25% (IQ1) | 1.7% | 0.93% |
| Interquartile 75% (IQ3) | 3.8% | 2.4% |
| Interquartile Range (IQR) | 2.1% | 1.5% |
| Standard Deviation (Sample) | 1.6% | 1.1% |
| Standard Deviation (Population) | 1.6% | 1.1% |
Similar Demographics by Professional Degree
Demographics Similar to Liberians by Professional Degree
In terms of professional degree, the demographic groups most similar to Liberians are Cheyenne (3.6%, a difference of 0.010%), Immigrants from Dominica (3.6%, a difference of 0.050%), Japanese (3.5%, a difference of 0.070%), Immigrants from Portugal (3.5%, a difference of 0.11%), and Dominican (3.5%, a difference of 0.15%).
| Demographics | Rating | Rank | Professional Degree |
| Immigrants | Cuba | 0.6 /100 | #269 | Tragic 3.6% |
| Central Americans | 0.6 /100 | #270 | Tragic 3.6% |
| Belizeans | 0.5 /100 | #271 | Tragic 3.6% |
| Immigrants | Jamaica | 0.5 /100 | #272 | Tragic 3.6% |
| Americans | 0.5 /100 | #273 | Tragic 3.6% |
| Potawatomi | 0.5 /100 | #274 | Tragic 3.6% |
| Immigrants | Dominica | 0.5 /100 | #275 | Tragic 3.6% |
| Liberians | 0.5 /100 | #276 | Tragic 3.6% |
| Cheyenne | 0.5 /100 | #277 | Tragic 3.6% |
| Japanese | 0.5 /100 | #278 | Tragic 3.5% |
| Immigrants | Portugal | 0.5 /100 | #279 | Tragic 3.5% |
| Dominicans | 0.5 /100 | #280 | Tragic 3.5% |
| Apache | 0.5 /100 | #281 | Tragic 3.5% |
| Immigrants | Caribbean | 0.5 /100 | #282 | Tragic 3.5% |
| Comanche | 0.4 /100 | #283 | Tragic 3.5% |
Demographics Similar to Fijians by Professional Degree
In terms of professional degree, the demographic groups most similar to Fijians are Native/Alaskan (3.0%, a difference of 1.0%), Pennsylvania German (3.0%, a difference of 1.6%), Arapaho (2.9%, a difference of 1.8%), Navajo (2.9%, a difference of 1.9%), and Immigrants from Central America (2.9%, a difference of 2.0%).
| Demographics | Rating | Rank | Professional Degree |
| Bangladeshis | 0.0 /100 | #329 | Tragic 3.1% |
| Immigrants | Cabo Verde | 0.0 /100 | #330 | Tragic 3.1% |
| Kiowa | 0.0 /100 | #331 | Tragic 3.1% |
| Yakama | 0.0 /100 | #332 | Tragic 3.1% |
| Puget Sound Salish | 0.0 /100 | #333 | Tragic 3.1% |
| Pennsylvania Germans | 0.0 /100 | #334 | Tragic 3.0% |
| Natives/Alaskans | 0.0 /100 | #335 | Tragic 3.0% |
| Fijians | 0.0 /100 | #336 | Tragic 2.9% |
| Arapaho | 0.0 /100 | #337 | Tragic 2.9% |
| Navajo | 0.0 /100 | #338 | Tragic 2.9% |
| Immigrants | Central America | 0.0 /100 | #339 | Tragic 2.9% |
| Yup'ik | 0.0 /100 | #340 | Tragic 2.9% |
| Tohono O'odham | 0.0 /100 | #341 | Tragic 2.8% |
| Immigrants | Azores | 0.0 /100 | #342 | Tragic 2.8% |
| Mexicans | 0.0 /100 | #343 | Tragic 2.7% |