Tsimshian vs Immigrants from Albania Professional Degree
COMPARE
Tsimshian
Immigrants from Albania
Professional Degree
Professional Degree Comparison
Tsimshian
Immigrants from Albania
3.2%
PROFESSIONAL DEGREE
0.0/ 100
METRIC RATING
321st/ 347
METRIC RANK
4.8%
PROFESSIONAL DEGREE
93.3/ 100
METRIC RATING
125th/ 347
METRIC RANK
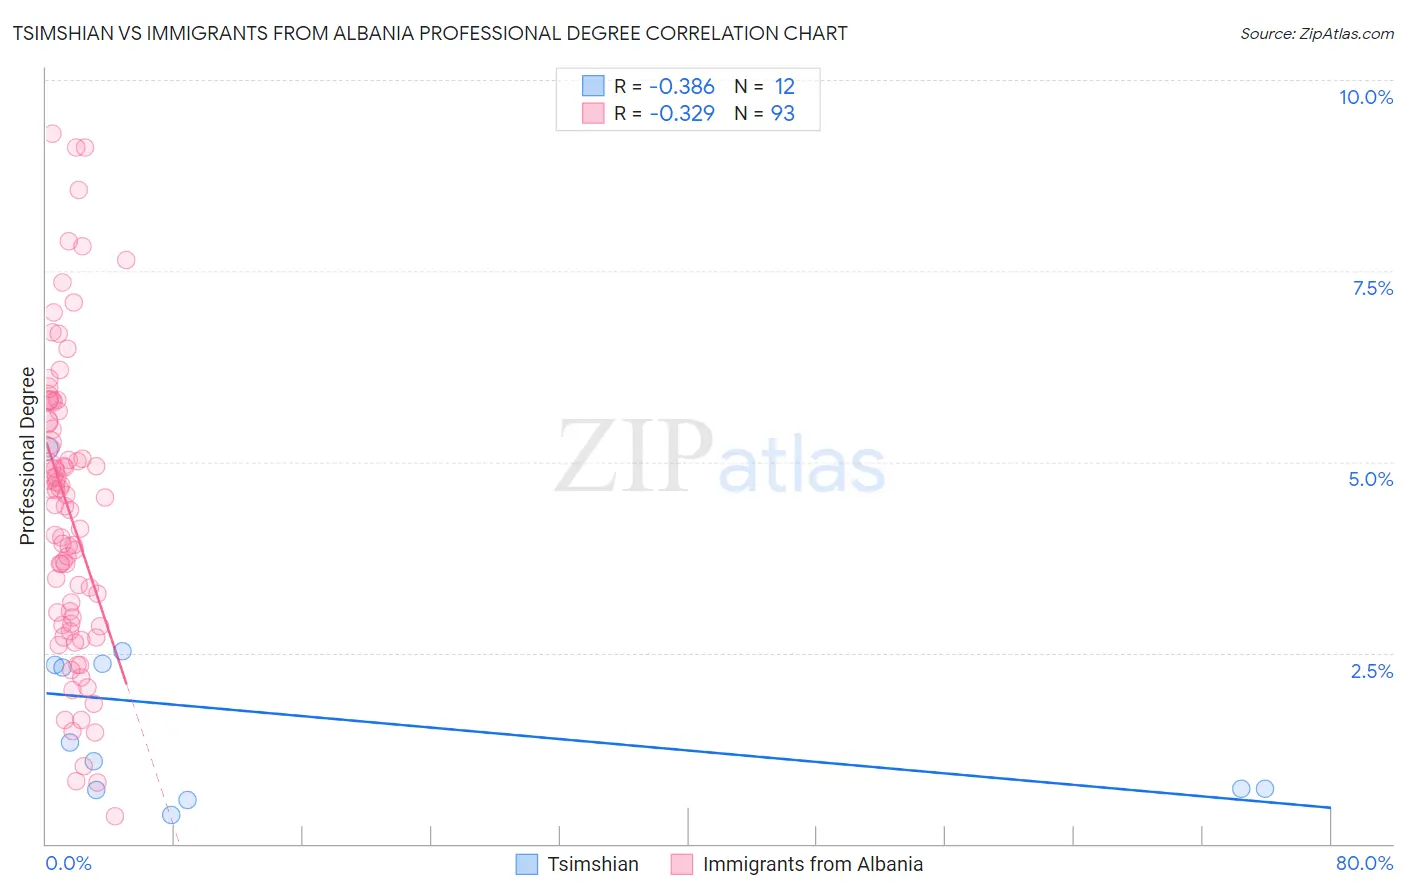
Tsimshian vs Immigrants from Albania Professional Degree Correlation Chart
The statistical analysis conducted on geographies consisting of 15,614,727 people shows a mild negative correlation between the proportion of Tsimshian and percentage of population with at least professional degree education in the United States with a correlation coefficient (R) of -0.386 and weighted average of 3.2%. Similarly, the statistical analysis conducted on geographies consisting of 119,335,838 people shows a mild negative correlation between the proportion of Immigrants from Albania and percentage of population with at least professional degree education in the United States with a correlation coefficient (R) of -0.329 and weighted average of 4.8%, a difference of 51.7%.
Professional Degree Correlation Summary
| Measurement | Tsimshian | Immigrants from Albania |
| Minimum | 0.38% | 0.35% |
| Maximum | 5.2% | 9.3% |
| Range | 4.8% | 8.9% |
| Mean | 1.7% | 4.4% |
| Median | 1.2% | 4.4% |
| Interquartile 25% (IQ1) | 0.71% | 2.9% |
| Interquartile 75% (IQ3) | 2.4% | 5.6% |
| Interquartile Range (IQR) | 1.6% | 2.7% |
| Standard Deviation (Sample) | 1.4% | 2.0% |
| Standard Deviation (Population) | 1.3% | 1.9% |
Similar Demographics by Professional Degree
Demographics Similar to Tsimshian by Professional Degree
In terms of professional degree, the demographic groups most similar to Tsimshian are Seminole (3.2%, a difference of 0.36%), Hispanic or Latino (3.2%, a difference of 0.36%), Inupiat (3.2%, a difference of 0.44%), Crow (3.2%, a difference of 0.72%), and Yaqui (3.2%, a difference of 0.78%).
| Demographics | Rating | Rank | Professional Degree |
| Mexican American Indians | 0.1 /100 | #314 | Tragic 3.3% |
| Immigrants | Laos | 0.1 /100 | #315 | Tragic 3.2% |
| Puerto Ricans | 0.1 /100 | #316 | Tragic 3.2% |
| Nepalese | 0.1 /100 | #317 | Tragic 3.2% |
| Immigrants | Micronesia | 0.1 /100 | #318 | Tragic 3.2% |
| Choctaw | 0.1 /100 | #319 | Tragic 3.2% |
| Seminole | 0.1 /100 | #320 | Tragic 3.2% |
| Tsimshian | 0.0 /100 | #321 | Tragic 3.2% |
| Hispanics or Latinos | 0.0 /100 | #322 | Tragic 3.2% |
| Inupiat | 0.0 /100 | #323 | Tragic 3.2% |
| Crow | 0.0 /100 | #324 | Tragic 3.2% |
| Yaqui | 0.0 /100 | #325 | Tragic 3.2% |
| Menominee | 0.0 /100 | #326 | Tragic 3.1% |
| Dutch West Indians | 0.0 /100 | #327 | Tragic 3.1% |
| Creek | 0.0 /100 | #328 | Tragic 3.1% |
Demographics Similar to Immigrants from Albania by Professional Degree
In terms of professional degree, the demographic groups most similar to Immigrants from Albania are European (4.8%, a difference of 0.050%), Immigrants from Eritrea (4.8%, a difference of 0.12%), Immigrants from Venezuela (4.8%, a difference of 0.31%), Serbian (4.8%, a difference of 0.35%), and Immigrants from Eastern Africa (4.8%, a difference of 0.37%).
| Demographics | Rating | Rank | Professional Degree |
| Croatians | 96.0 /100 | #118 | Exceptional 4.9% |
| Immigrants | Sudan | 95.4 /100 | #119 | Exceptional 4.9% |
| Albanians | 95.3 /100 | #120 | Exceptional 4.9% |
| Immigrants | Moldova | 94.8 /100 | #121 | Exceptional 4.9% |
| Immigrants | Germany | 94.1 /100 | #122 | Exceptional 4.9% |
| Immigrants | Venezuela | 93.8 /100 | #123 | Exceptional 4.8% |
| Immigrants | Eritrea | 93.5 /100 | #124 | Exceptional 4.8% |
| Immigrants | Albania | 93.3 /100 | #125 | Exceptional 4.8% |
| Europeans | 93.2 /100 | #126 | Exceptional 4.8% |
| Serbians | 92.6 /100 | #127 | Exceptional 4.8% |
| Immigrants | Eastern Africa | 92.5 /100 | #128 | Exceptional 4.8% |
| Palestinians | 91.5 /100 | #129 | Exceptional 4.8% |
| Icelanders | 91.5 /100 | #130 | Exceptional 4.8% |
| Immigrants | Nepal | 91.4 /100 | #131 | Exceptional 4.8% |
| Pakistanis | 90.9 /100 | #132 | Exceptional 4.8% |