Tsimshian vs Central American 11th Grade
COMPARE
Tsimshian
Central American
11th Grade
11th Grade Comparison
Tsimshian
Central Americans
94.4%
11TH GRADE
100.0/ 100
METRIC RATING
22nd/ 347
METRIC RANK
86.9%
11TH GRADE
0.0/ 100
METRIC RATING
335th/ 347
METRIC RANK
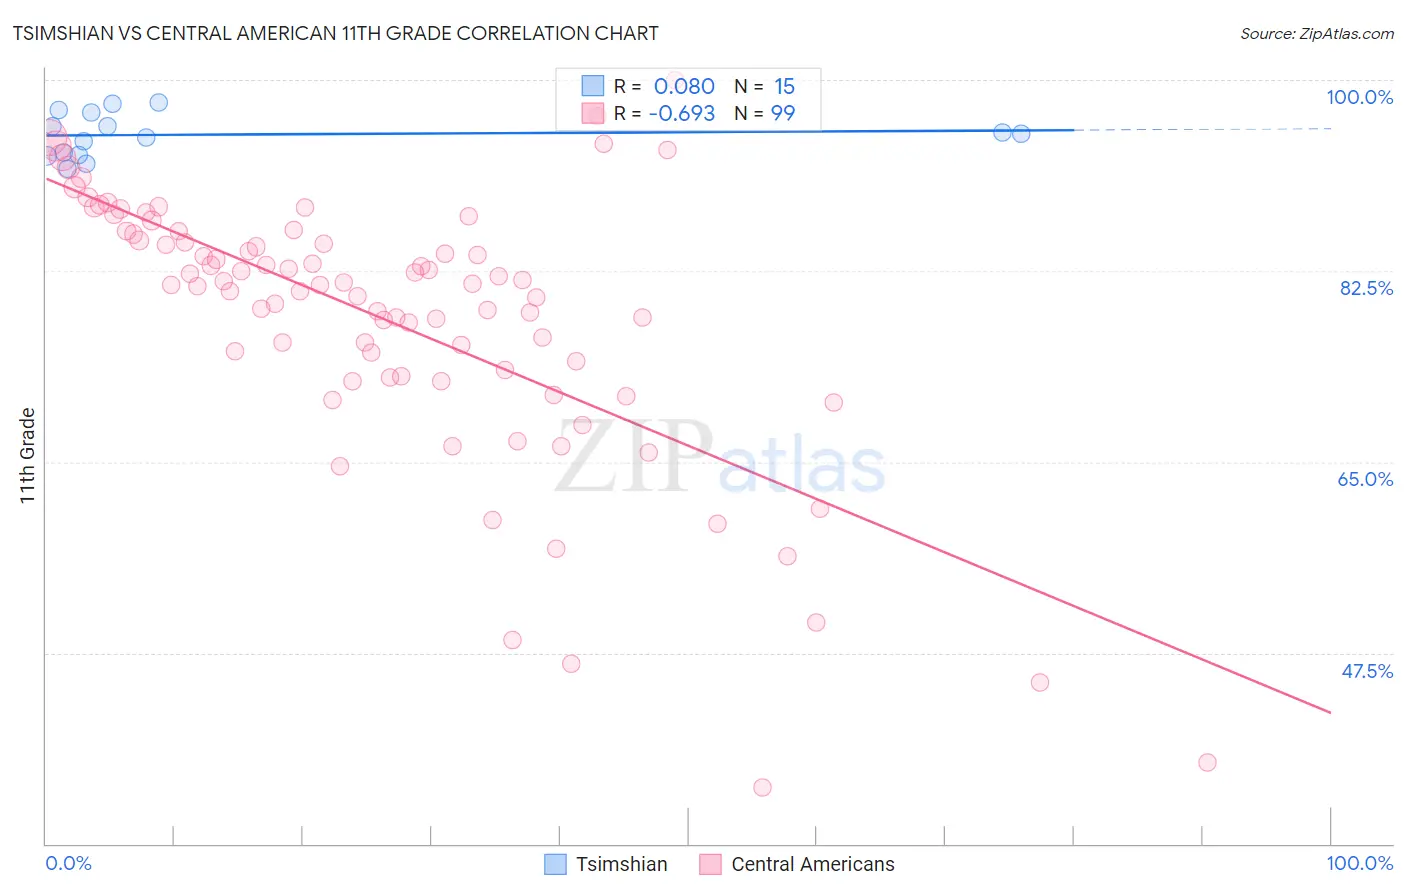
Tsimshian vs Central American 11th Grade Correlation Chart
The statistical analysis conducted on geographies consisting of 15,626,544 people shows a slight positive correlation between the proportion of Tsimshian and percentage of population with at least 11th grade education in the United States with a correlation coefficient (R) of 0.080 and weighted average of 94.4%. Similarly, the statistical analysis conducted on geographies consisting of 504,619,347 people shows a significant negative correlation between the proportion of Central Americans and percentage of population with at least 11th grade education in the United States with a correlation coefficient (R) of -0.693 and weighted average of 86.9%, a difference of 8.6%.
11th Grade Correlation Summary
| Measurement | Tsimshian | Central American |
| Minimum | 91.9% | 35.2% |
| Maximum | 98.0% | 100.0% |
| Range | 6.1% | 64.8% |
| Mean | 95.0% | 78.1% |
| Median | 95.1% | 81.3% |
| Interquartile 25% (IQ1) | 93.1% | 72.9% |
| Interquartile 75% (IQ3) | 97.0% | 85.9% |
| Interquartile Range (IQR) | 4.0% | 13.0% |
| Standard Deviation (Sample) | 2.0% | 12.4% |
| Standard Deviation (Population) | 1.9% | 12.3% |
Similar Demographics by 11th Grade
Demographics Similar to Tsimshian by 11th Grade
In terms of 11th grade, the demographic groups most similar to Tsimshian are Czech (94.4%, a difference of 0.0%), Tlingit-Haida (94.4%, a difference of 0.010%), Italian (94.5%, a difference of 0.020%), English (94.4%, a difference of 0.030%), and Irish (94.4%, a difference of 0.050%).
| Demographics | Rating | Rank | 11th Grade |
| Bulgarians | 100.0 /100 | #15 | Exceptional 94.5% |
| Immigrants | India | 100.0 /100 | #16 | Exceptional 94.5% |
| Luxembourgers | 100.0 /100 | #17 | Exceptional 94.5% |
| Maltese | 100.0 /100 | #18 | Exceptional 94.5% |
| Scandinavians | 100.0 /100 | #19 | Exceptional 94.5% |
| Italians | 100.0 /100 | #20 | Exceptional 94.5% |
| Tlingit-Haida | 100.0 /100 | #21 | Exceptional 94.4% |
| Tsimshian | 100.0 /100 | #22 | Exceptional 94.4% |
| Czechs | 100.0 /100 | #23 | Exceptional 94.4% |
| English | 100.0 /100 | #24 | Exceptional 94.4% |
| Irish | 100.0 /100 | #25 | Exceptional 94.4% |
| Scottish | 100.0 /100 | #26 | Exceptional 94.4% |
| Europeans | 100.0 /100 | #27 | Exceptional 94.4% |
| Estonians | 100.0 /100 | #28 | Exceptional 94.4% |
| Dutch | 100.0 /100 | #29 | Exceptional 94.3% |
Demographics Similar to Central Americans by 11th Grade
In terms of 11th grade, the demographic groups most similar to Central Americans are Immigrants from Dominican Republic (86.9%, a difference of 0.040%), Immigrants from Honduras (86.9%, a difference of 0.040%), Houma (87.0%, a difference of 0.10%), Immigrants from Yemen (87.1%, a difference of 0.16%), and Immigrants from Latin America (86.8%, a difference of 0.17%).
| Demographics | Rating | Rank | 11th Grade |
| Tohono O'odham | 0.0 /100 | #328 | Tragic 87.6% |
| Mexican American Indians | 0.0 /100 | #329 | Tragic 87.5% |
| Hondurans | 0.0 /100 | #330 | Tragic 87.4% |
| Hispanics or Latinos | 0.0 /100 | #331 | Tragic 87.3% |
| Immigrants | Azores | 0.0 /100 | #332 | Tragic 87.2% |
| Immigrants | Yemen | 0.0 /100 | #333 | Tragic 87.1% |
| Houma | 0.0 /100 | #334 | Tragic 87.0% |
| Central Americans | 0.0 /100 | #335 | Tragic 86.9% |
| Immigrants | Dominican Republic | 0.0 /100 | #336 | Tragic 86.9% |
| Immigrants | Honduras | 0.0 /100 | #337 | Tragic 86.9% |
| Immigrants | Latin America | 0.0 /100 | #338 | Tragic 86.8% |
| Guatemalans | 0.0 /100 | #339 | Tragic 86.4% |
| Salvadorans | 0.0 /100 | #340 | Tragic 86.2% |
| Mexicans | 0.0 /100 | #341 | Tragic 86.1% |
| Immigrants | Guatemala | 0.0 /100 | #342 | Tragic 85.8% |