Tsimshian vs Cuban In Labor Force | Age 45-54
COMPARE
Tsimshian
Cuban
In Labor Force | Age 45-54
In Labor Force | Age 45-54 Comparison
Tsimshian
Cubans
77.4%
IN LABOR FORCE | AGE 45-54
0.0/ 100
METRIC RATING
331st/ 347
METRIC RANK
83.4%
IN LABOR FORCE | AGE 45-54
96.7/ 100
METRIC RATING
77th/ 347
METRIC RANK
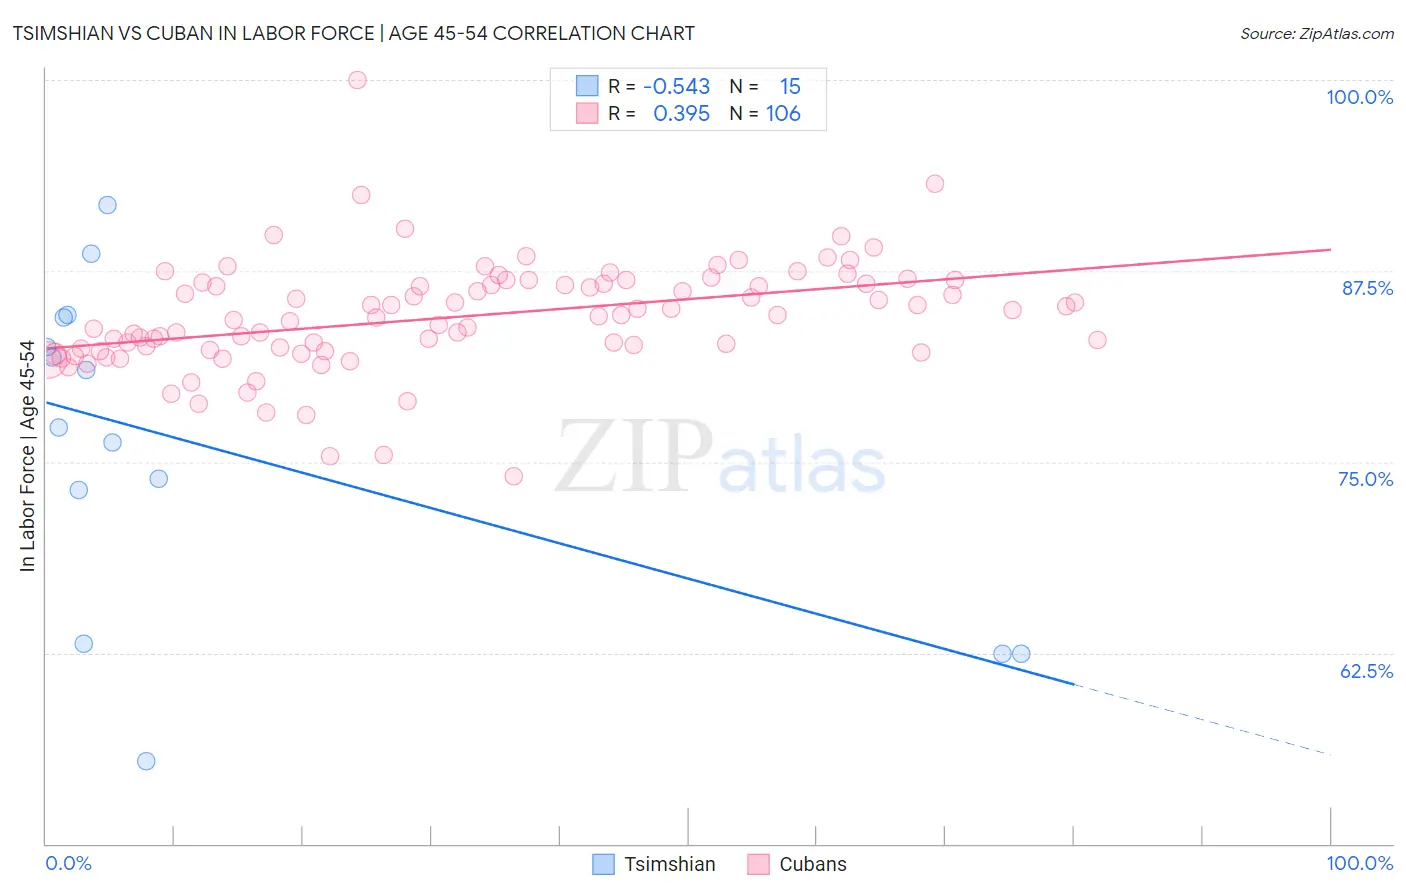
Tsimshian vs Cuban In Labor Force | Age 45-54 Correlation Chart
The statistical analysis conducted on geographies consisting of 15,626,261 people shows a substantial negative correlation between the proportion of Tsimshian and labor force participation rate among population between the ages 45 and 54 in the United States with a correlation coefficient (R) of -0.543 and weighted average of 77.4%. Similarly, the statistical analysis conducted on geographies consisting of 448,959,776 people shows a mild positive correlation between the proportion of Cubans and labor force participation rate among population between the ages 45 and 54 in the United States with a correlation coefficient (R) of 0.395 and weighted average of 83.4%, a difference of 7.7%.
In Labor Force | Age 45-54 Correlation Summary
| Measurement | Tsimshian | Cuban |
| Minimum | 55.4% | 74.0% |
| Maximum | 91.8% | 100.0% |
| Range | 36.4% | 26.0% |
| Mean | 75.9% | 84.5% |
| Median | 77.2% | 84.6% |
| Interquartile 25% (IQ1) | 63.1% | 82.3% |
| Interquartile 75% (IQ3) | 84.5% | 86.7% |
| Interquartile Range (IQR) | 21.4% | 4.4% |
| Standard Deviation (Sample) | 10.8% | 3.6% |
| Standard Deviation (Population) | 10.4% | 3.6% |
Similar Demographics by In Labor Force | Age 45-54
Demographics Similar to Tsimshian by In Labor Force | Age 45-54
In terms of in labor force | age 45-54, the demographic groups most similar to Tsimshian are Menominee (77.4%, a difference of 0.030%), Cheyenne (77.6%, a difference of 0.15%), Creek (77.7%, a difference of 0.37%), Native/Alaskan (77.1%, a difference of 0.39%), and Apache (77.1%, a difference of 0.39%).
| Demographics | Rating | Rank | In Labor Force | Age 45-54 |
| Dutch West Indians | 0.0 /100 | #324 | Tragic 78.2% |
| Choctaw | 0.0 /100 | #325 | Tragic 78.2% |
| Seminole | 0.0 /100 | #326 | Tragic 78.1% |
| Cajuns | 0.0 /100 | #327 | Tragic 78.1% |
| Sioux | 0.0 /100 | #328 | Tragic 78.0% |
| Creek | 0.0 /100 | #329 | Tragic 77.7% |
| Cheyenne | 0.0 /100 | #330 | Tragic 77.6% |
| Tsimshian | 0.0 /100 | #331 | Tragic 77.4% |
| Menominee | 0.0 /100 | #332 | Tragic 77.4% |
| Natives/Alaskans | 0.0 /100 | #333 | Tragic 77.1% |
| Apache | 0.0 /100 | #334 | Tragic 77.1% |
| Arapaho | 0.0 /100 | #335 | Tragic 77.1% |
| Paiute | 0.0 /100 | #336 | Tragic 76.7% |
| Ute | 0.0 /100 | #337 | Tragic 76.6% |
| Yuman | 0.0 /100 | #338 | Tragic 76.3% |
Demographics Similar to Cubans by In Labor Force | Age 45-54
In terms of in labor force | age 45-54, the demographic groups most similar to Cubans are Immigrants from Somalia (83.4%, a difference of 0.010%), Estonian (83.4%, a difference of 0.010%), Russian (83.4%, a difference of 0.010%), Immigrants from Egypt (83.4%, a difference of 0.010%), and Belgian (83.4%, a difference of 0.010%).
| Demographics | Rating | Rank | In Labor Force | Age 45-54 |
| Immigrants | Latvia | 97.4 /100 | #70 | Exceptional 83.4% |
| Colombians | 97.3 /100 | #71 | Exceptional 83.4% |
| Serbians | 97.2 /100 | #72 | Exceptional 83.4% |
| Immigrants | Czechoslovakia | 97.1 /100 | #73 | Exceptional 83.4% |
| Immigrants | Somalia | 96.9 /100 | #74 | Exceptional 83.4% |
| Estonians | 96.9 /100 | #75 | Exceptional 83.4% |
| Russians | 96.8 /100 | #76 | Exceptional 83.4% |
| Cubans | 96.7 /100 | #77 | Exceptional 83.4% |
| Immigrants | Egypt | 96.6 /100 | #78 | Exceptional 83.4% |
| Belgians | 96.5 /100 | #79 | Exceptional 83.4% |
| Immigrants | Croatia | 96.5 /100 | #80 | Exceptional 83.4% |
| Jordanians | 96.4 /100 | #81 | Exceptional 83.4% |
| Immigrants | Eastern Asia | 96.3 /100 | #82 | Exceptional 83.4% |
| Immigrants | Zimbabwe | 96.3 /100 | #83 | Exceptional 83.4% |
| Immigrants | Bosnia and Herzegovina | 96.0 /100 | #84 | Exceptional 83.3% |