Tsimshian vs Immigrants from Belize 11th Grade
COMPARE
Tsimshian
Immigrants from Belize
11th Grade
11th Grade Comparison
Tsimshian
Immigrants from Belize
94.4%
11TH GRADE
100.0/ 100
METRIC RATING
22nd/ 347
METRIC RANK
88.7%
11TH GRADE
0.0/ 100
METRIC RATING
321st/ 347
METRIC RANK
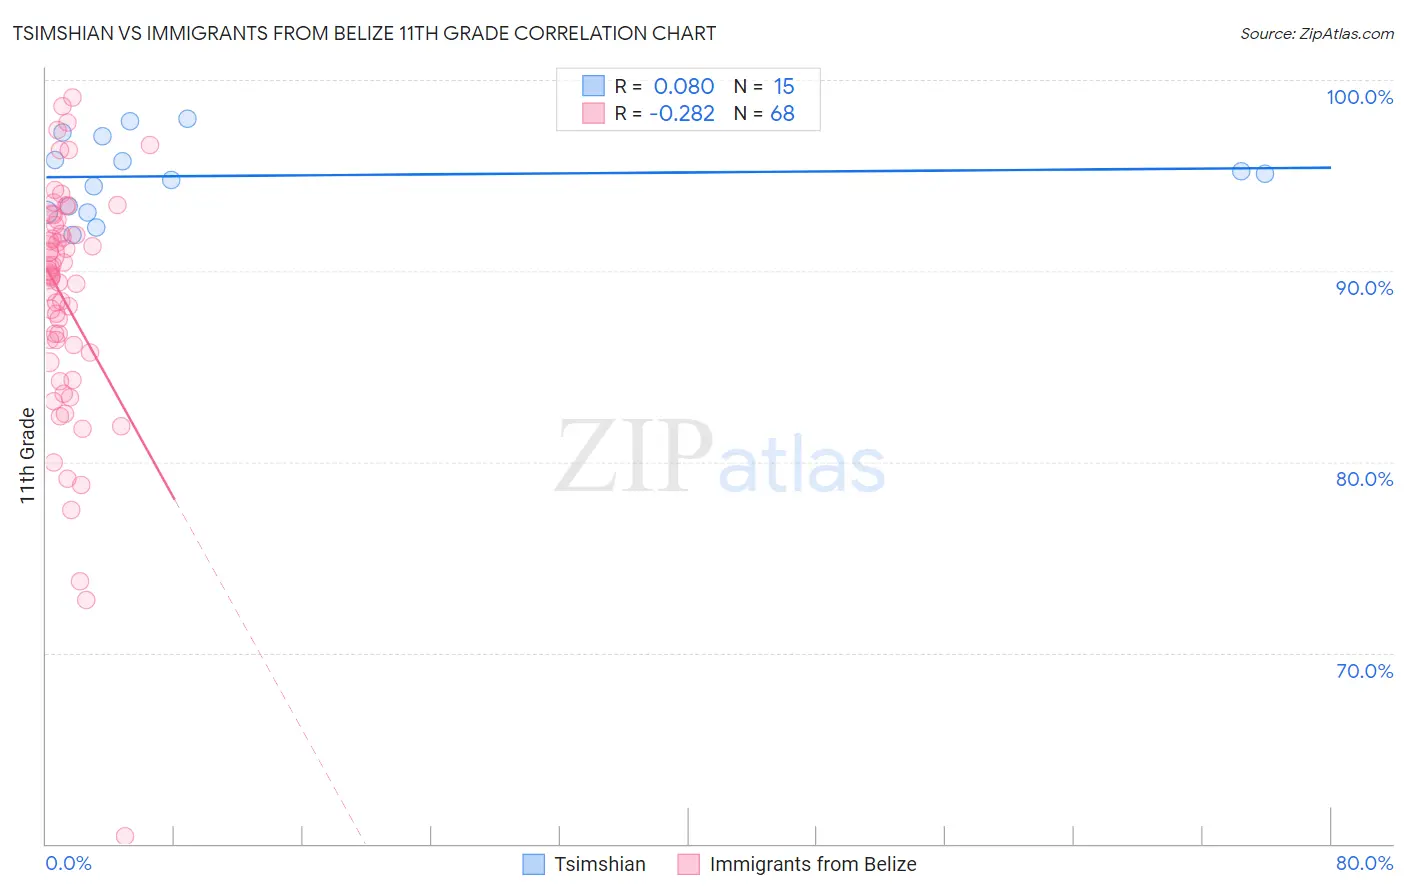
Tsimshian vs Immigrants from Belize 11th Grade Correlation Chart
The statistical analysis conducted on geographies consisting of 15,626,544 people shows a slight positive correlation between the proportion of Tsimshian and percentage of population with at least 11th grade education in the United States with a correlation coefficient (R) of 0.080 and weighted average of 94.4%. Similarly, the statistical analysis conducted on geographies consisting of 130,181,087 people shows a weak negative correlation between the proportion of Immigrants from Belize and percentage of population with at least 11th grade education in the United States with a correlation coefficient (R) of -0.282 and weighted average of 88.7%, a difference of 6.5%.
11th Grade Correlation Summary
| Measurement | Tsimshian | Immigrants from Belize |
| Minimum | 91.9% | 60.4% |
| Maximum | 98.0% | 99.1% |
| Range | 6.1% | 38.7% |
| Mean | 95.0% | 88.4% |
| Median | 95.1% | 89.7% |
| Interquartile 25% (IQ1) | 93.1% | 85.5% |
| Interquartile 75% (IQ3) | 97.0% | 92.2% |
| Interquartile Range (IQR) | 4.0% | 6.7% |
| Standard Deviation (Sample) | 2.0% | 6.5% |
| Standard Deviation (Population) | 1.9% | 6.5% |
Similar Demographics by 11th Grade
Demographics Similar to Tsimshian by 11th Grade
In terms of 11th grade, the demographic groups most similar to Tsimshian are Czech (94.4%, a difference of 0.0%), Tlingit-Haida (94.4%, a difference of 0.010%), Italian (94.5%, a difference of 0.020%), English (94.4%, a difference of 0.030%), and Irish (94.4%, a difference of 0.050%).
| Demographics | Rating | Rank | 11th Grade |
| Bulgarians | 100.0 /100 | #15 | Exceptional 94.5% |
| Immigrants | India | 100.0 /100 | #16 | Exceptional 94.5% |
| Luxembourgers | 100.0 /100 | #17 | Exceptional 94.5% |
| Maltese | 100.0 /100 | #18 | Exceptional 94.5% |
| Scandinavians | 100.0 /100 | #19 | Exceptional 94.5% |
| Italians | 100.0 /100 | #20 | Exceptional 94.5% |
| Tlingit-Haida | 100.0 /100 | #21 | Exceptional 94.4% |
| Tsimshian | 100.0 /100 | #22 | Exceptional 94.4% |
| Czechs | 100.0 /100 | #23 | Exceptional 94.4% |
| English | 100.0 /100 | #24 | Exceptional 94.4% |
| Irish | 100.0 /100 | #25 | Exceptional 94.4% |
| Scottish | 100.0 /100 | #26 | Exceptional 94.4% |
| Europeans | 100.0 /100 | #27 | Exceptional 94.4% |
| Estonians | 100.0 /100 | #28 | Exceptional 94.4% |
| Dutch | 100.0 /100 | #29 | Exceptional 94.3% |
Demographics Similar to Immigrants from Belize by 11th Grade
In terms of 11th grade, the demographic groups most similar to Immigrants from Belize are Immigrants from Armenia (88.8%, a difference of 0.090%), Belizean (88.8%, a difference of 0.11%), Nicaraguan (88.9%, a difference of 0.20%), Lumbee (88.9%, a difference of 0.26%), and Immigrants from Cuba (88.9%, a difference of 0.27%).
| Demographics | Rating | Rank | 11th Grade |
| Cape Verdeans | 0.0 /100 | #314 | Tragic 89.1% |
| Immigrants | Ecuador | 0.0 /100 | #315 | Tragic 89.1% |
| Immigrants | Cuba | 0.0 /100 | #316 | Tragic 88.9% |
| Lumbee | 0.0 /100 | #317 | Tragic 88.9% |
| Nicaraguans | 0.0 /100 | #318 | Tragic 88.9% |
| Belizeans | 0.0 /100 | #319 | Tragic 88.8% |
| Immigrants | Armenia | 0.0 /100 | #320 | Tragic 88.8% |
| Immigrants | Belize | 0.0 /100 | #321 | Tragic 88.7% |
| Puerto Ricans | 0.0 /100 | #322 | Tragic 88.4% |
| Pima | 0.0 /100 | #323 | Tragic 88.3% |
| Central American Indians | 0.0 /100 | #324 | Tragic 88.2% |
| Immigrants | Nicaragua | 0.0 /100 | #325 | Tragic 88.1% |
| Dominicans | 0.0 /100 | #326 | Tragic 87.7% |
| Immigrants | Cabo Verde | 0.0 /100 | #327 | Tragic 87.6% |
| Tohono O'odham | 0.0 /100 | #328 | Tragic 87.6% |