Thai vs American No Schooling Completed
COMPARE
Thai
American
No Schooling Completed
No Schooling Completed Comparison
Thais
Americans
1.8%
NO SCHOOLING COMPLETED
97.5/ 100
METRIC RATING
104th/ 347
METRIC RANK
1.7%
NO SCHOOLING COMPLETED
99.8/ 100
METRIC RATING
60th/ 347
METRIC RANK
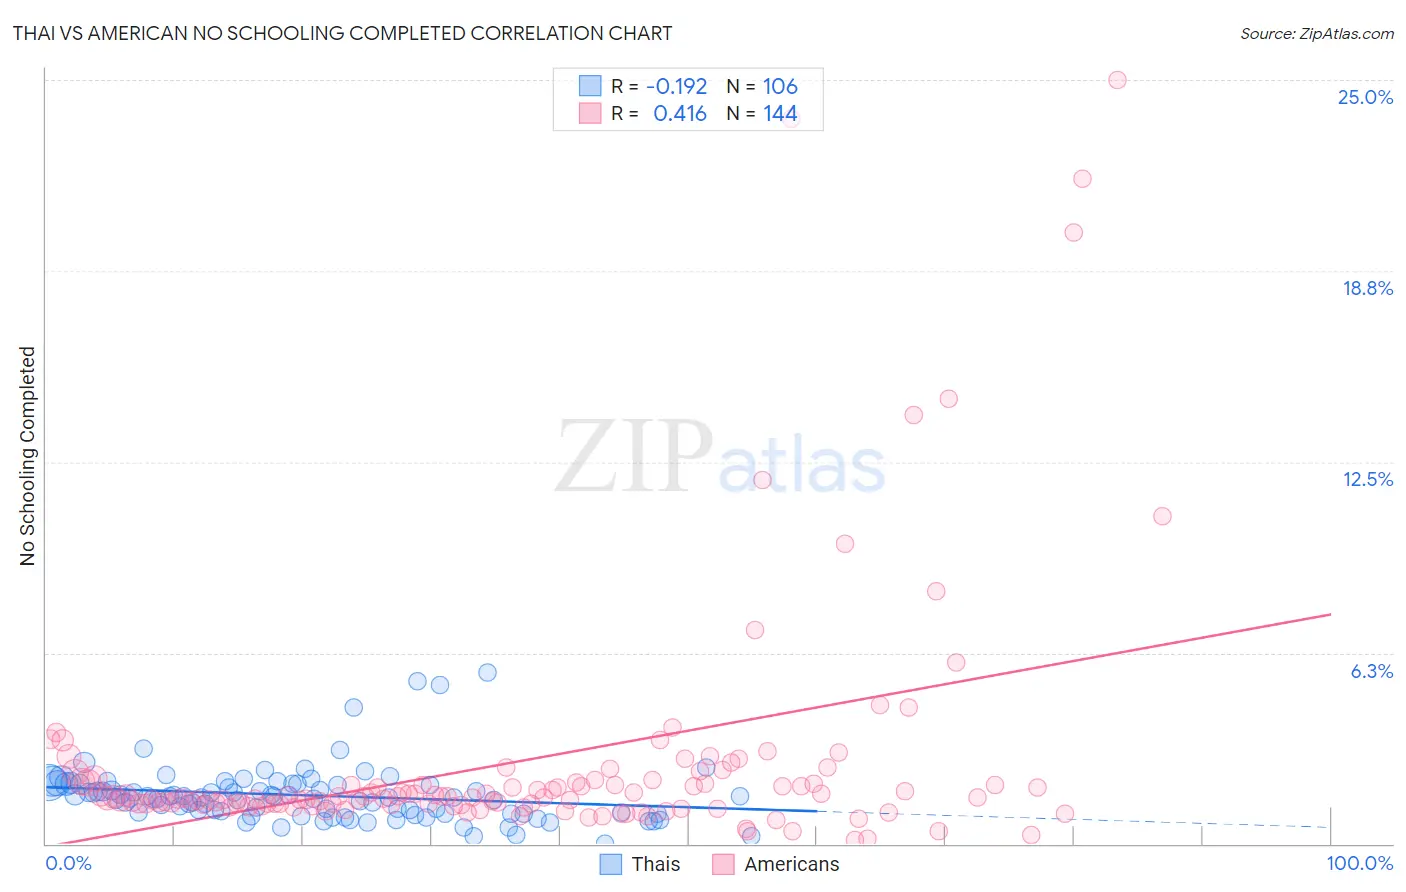
Thai vs American No Schooling Completed Correlation Chart
The statistical analysis conducted on geographies consisting of 469,412,663 people shows a poor negative correlation between the proportion of Thais and percentage of population with no schooling in the United States with a correlation coefficient (R) of -0.192 and weighted average of 1.8%. Similarly, the statistical analysis conducted on geographies consisting of 561,195,336 people shows a moderate positive correlation between the proportion of Americans and percentage of population with no schooling in the United States with a correlation coefficient (R) of 0.416 and weighted average of 1.7%, a difference of 10.9%.
No Schooling Completed Correlation Summary
| Measurement | Thai | American |
| Minimum | 0.015% | 0.13% |
| Maximum | 5.6% | 25.0% |
| Range | 5.6% | 24.9% |
| Mean | 1.6% | 2.7% |
| Median | 1.5% | 1.5% |
| Interquartile 25% (IQ1) | 1.0% | 1.3% |
| Interquartile 75% (IQ3) | 2.0% | 2.0% |
| Interquartile Range (IQR) | 0.95% | 0.72% |
| Standard Deviation (Sample) | 0.92% | 4.1% |
| Standard Deviation (Population) | 0.92% | 4.0% |
Similar Demographics by No Schooling Completed
Demographics Similar to Thais by No Schooling Completed
In terms of no schooling completed, the demographic groups most similar to Thais are German Russian (1.8%, a difference of 0.020%), Immigrants from France (1.8%, a difference of 0.42%), Yugoslavian (1.8%, a difference of 0.46%), Basque (1.8%, a difference of 0.57%), and Immigrants from Czechoslovakia (1.8%, a difference of 0.63%).
| Demographics | Rating | Rank | No Schooling Completed |
| Immigrants | Ireland | 98.4 /100 | #97 | Exceptional 1.8% |
| Iranians | 98.2 /100 | #98 | Exceptional 1.8% |
| Choctaw | 98.1 /100 | #99 | Exceptional 1.8% |
| Immigrants | Singapore | 98.0 /100 | #100 | Exceptional 1.8% |
| Immigrants | Czechoslovakia | 97.9 /100 | #101 | Exceptional 1.8% |
| Immigrants | Switzerland | 97.9 /100 | #102 | Exceptional 1.8% |
| Basques | 97.9 /100 | #103 | Exceptional 1.8% |
| Thais | 97.5 /100 | #104 | Exceptional 1.8% |
| German Russians | 97.5 /100 | #105 | Exceptional 1.8% |
| Immigrants | France | 97.3 /100 | #106 | Exceptional 1.8% |
| Yugoslavians | 97.2 /100 | #107 | Exceptional 1.8% |
| Okinawans | 97.1 /100 | #108 | Exceptional 1.8% |
| Immigrants | Saudi Arabia | 96.8 /100 | #109 | Exceptional 1.9% |
| Immigrants | Latvia | 96.7 /100 | #110 | Exceptional 1.9% |
| Immigrants | Japan | 96.6 /100 | #111 | Exceptional 1.9% |
Demographics Similar to Americans by No Schooling Completed
In terms of no schooling completed, the demographic groups most similar to Americans are Slavic (1.7%, a difference of 0.12%), Kiowa (1.6%, a difference of 0.19%), Tsimshian (1.7%, a difference of 0.29%), Austrian (1.6%, a difference of 0.35%), and Greek (1.6%, a difference of 0.66%).
| Demographics | Rating | Rank | No Schooling Completed |
| Creek | 99.8 /100 | #53 | Exceptional 1.6% |
| Crow | 99.8 /100 | #54 | Exceptional 1.6% |
| Greeks | 99.8 /100 | #55 | Exceptional 1.6% |
| Immigrants | North America | 99.8 /100 | #56 | Exceptional 1.6% |
| Austrians | 99.8 /100 | #57 | Exceptional 1.6% |
| Kiowa | 99.8 /100 | #58 | Exceptional 1.6% |
| Slavs | 99.8 /100 | #59 | Exceptional 1.7% |
| Americans | 99.8 /100 | #60 | Exceptional 1.7% |
| Tsimshian | 99.8 /100 | #61 | Exceptional 1.7% |
| Immigrants | Northern Europe | 99.8 /100 | #62 | Exceptional 1.7% |
| Russians | 99.8 /100 | #63 | Exceptional 1.7% |
| New Zealanders | 99.7 /100 | #64 | Exceptional 1.7% |
| Serbians | 99.7 /100 | #65 | Exceptional 1.7% |
| Canadians | 99.7 /100 | #66 | Exceptional 1.7% |
| Immigrants | Austria | 99.7 /100 | #67 | Exceptional 1.7% |