Immigrants from Croatia vs American No Schooling Completed
COMPARE
Immigrants from Croatia
American
No Schooling Completed
No Schooling Completed Comparison
Immigrants from Croatia
Americans
1.9%
NO SCHOOLING COMPLETED
94.5/ 100
METRIC RATING
121st/ 347
METRIC RANK
1.7%
NO SCHOOLING COMPLETED
99.8/ 100
METRIC RATING
60th/ 347
METRIC RANK
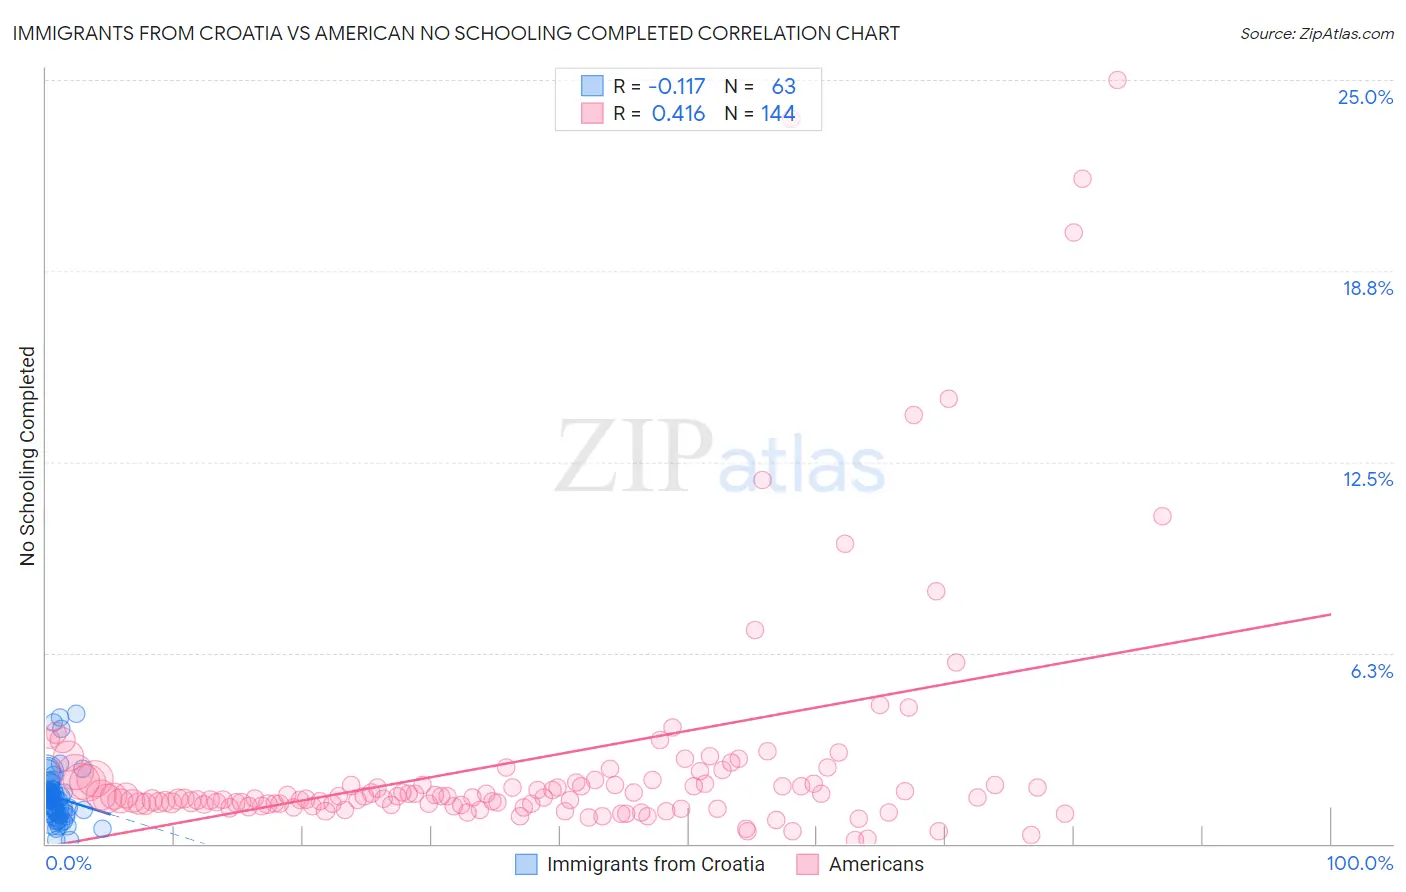
Immigrants from Croatia vs American No Schooling Completed Correlation Chart
The statistical analysis conducted on geographies consisting of 132,073,413 people shows a poor negative correlation between the proportion of Immigrants from Croatia and percentage of population with no schooling in the United States with a correlation coefficient (R) of -0.117 and weighted average of 1.9%. Similarly, the statistical analysis conducted on geographies consisting of 561,195,336 people shows a moderate positive correlation between the proportion of Americans and percentage of population with no schooling in the United States with a correlation coefficient (R) of 0.416 and weighted average of 1.7%, a difference of 14.5%.
No Schooling Completed Correlation Summary
| Measurement | Immigrants from Croatia | American |
| Minimum | 0.11% | 0.13% |
| Maximum | 4.2% | 25.0% |
| Range | 4.1% | 24.9% |
| Mean | 1.5% | 2.7% |
| Median | 1.4% | 1.5% |
| Interquartile 25% (IQ1) | 0.97% | 1.3% |
| Interquartile 75% (IQ3) | 1.7% | 2.0% |
| Interquartile Range (IQR) | 0.77% | 0.72% |
| Standard Deviation (Sample) | 0.87% | 4.1% |
| Standard Deviation (Population) | 0.86% | 4.0% |
Similar Demographics by No Schooling Completed
Demographics Similar to Immigrants from Croatia by No Schooling Completed
In terms of no schooling completed, the demographic groups most similar to Immigrants from Croatia are Cree (1.9%, a difference of 0.030%), Immigrants from Bulgaria (1.9%, a difference of 0.060%), Immigrants from Kuwait (1.9%, a difference of 0.39%), Iroquois (1.9%, a difference of 0.47%), and Cambodian (1.9%, a difference of 0.47%).
| Demographics | Rating | Rank | No Schooling Completed |
| Immigrants | Norway | 96.1 /100 | #114 | Exceptional 1.9% |
| Syrians | 96.0 /100 | #115 | Exceptional 1.9% |
| Lebanese | 96.0 /100 | #116 | Exceptional 1.9% |
| Immigrants | Serbia | 95.8 /100 | #117 | Exceptional 1.9% |
| Spanish | 95.5 /100 | #118 | Exceptional 1.9% |
| Iroquois | 95.1 /100 | #119 | Exceptional 1.9% |
| Immigrants | Bulgaria | 94.6 /100 | #120 | Exceptional 1.9% |
| Immigrants | Croatia | 94.5 /100 | #121 | Exceptional 1.9% |
| Cree | 94.5 /100 | #122 | Exceptional 1.9% |
| Immigrants | Kuwait | 93.9 /100 | #123 | Exceptional 1.9% |
| Cambodians | 93.8 /100 | #124 | Exceptional 1.9% |
| Immigrants | Europe | 93.7 /100 | #125 | Exceptional 1.9% |
| Immigrants | Romania | 92.6 /100 | #126 | Exceptional 1.9% |
| Israelis | 92.4 /100 | #127 | Exceptional 1.9% |
| Spaniards | 92.3 /100 | #128 | Exceptional 1.9% |
Demographics Similar to Americans by No Schooling Completed
In terms of no schooling completed, the demographic groups most similar to Americans are Slavic (1.7%, a difference of 0.12%), Kiowa (1.6%, a difference of 0.19%), Tsimshian (1.7%, a difference of 0.29%), Austrian (1.6%, a difference of 0.35%), and Greek (1.6%, a difference of 0.66%).
| Demographics | Rating | Rank | No Schooling Completed |
| Creek | 99.8 /100 | #53 | Exceptional 1.6% |
| Crow | 99.8 /100 | #54 | Exceptional 1.6% |
| Greeks | 99.8 /100 | #55 | Exceptional 1.6% |
| Immigrants | North America | 99.8 /100 | #56 | Exceptional 1.6% |
| Austrians | 99.8 /100 | #57 | Exceptional 1.6% |
| Kiowa | 99.8 /100 | #58 | Exceptional 1.6% |
| Slavs | 99.8 /100 | #59 | Exceptional 1.7% |
| Americans | 99.8 /100 | #60 | Exceptional 1.7% |
| Tsimshian | 99.8 /100 | #61 | Exceptional 1.7% |
| Immigrants | Northern Europe | 99.8 /100 | #62 | Exceptional 1.7% |
| Russians | 99.8 /100 | #63 | Exceptional 1.7% |
| New Zealanders | 99.7 /100 | #64 | Exceptional 1.7% |
| Serbians | 99.7 /100 | #65 | Exceptional 1.7% |
| Canadians | 99.7 /100 | #66 | Exceptional 1.7% |
| Immigrants | Austria | 99.7 /100 | #67 | Exceptional 1.7% |