Dutch West Indian vs American No Schooling Completed
COMPARE
Dutch West Indian
American
No Schooling Completed
No Schooling Completed Comparison
Dutch West Indians
Americans
2.1%
NO SCHOOLING COMPLETED
59.9/ 100
METRIC RATING
166th/ 347
METRIC RANK
1.7%
NO SCHOOLING COMPLETED
99.8/ 100
METRIC RATING
60th/ 347
METRIC RANK
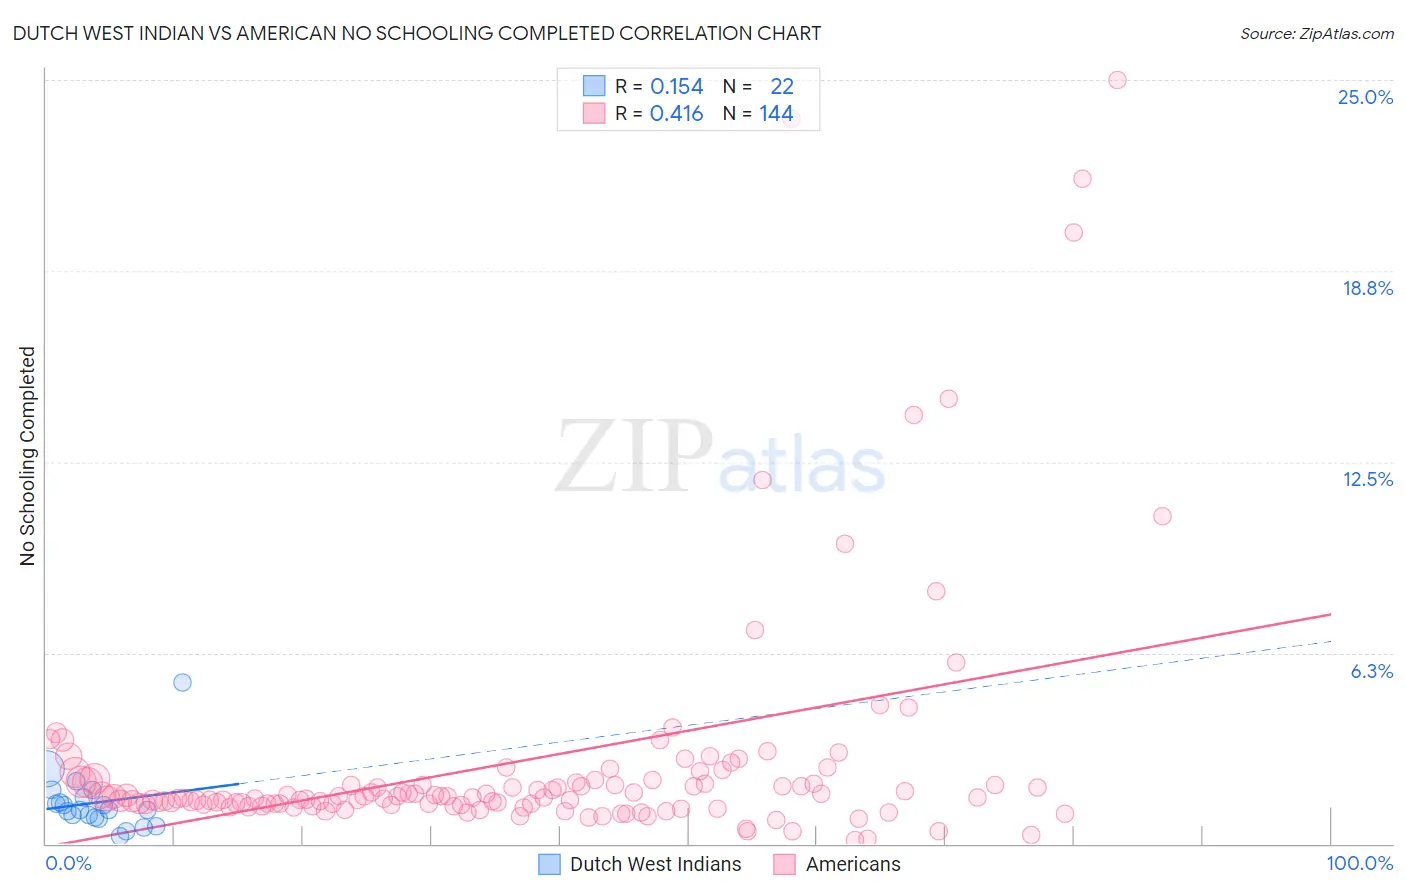
Dutch West Indian vs American No Schooling Completed Correlation Chart
The statistical analysis conducted on geographies consisting of 85,460,448 people shows a poor positive correlation between the proportion of Dutch West Indians and percentage of population with no schooling in the United States with a correlation coefficient (R) of 0.154 and weighted average of 2.1%. Similarly, the statistical analysis conducted on geographies consisting of 561,195,336 people shows a moderate positive correlation between the proportion of Americans and percentage of population with no schooling in the United States with a correlation coefficient (R) of 0.416 and weighted average of 1.7%, a difference of 24.8%.
No Schooling Completed Correlation Summary
| Measurement | Dutch West Indian | American |
| Minimum | 0.27% | 0.13% |
| Maximum | 5.3% | 25.0% |
| Range | 5.0% | 24.9% |
| Mean | 1.4% | 2.7% |
| Median | 1.1% | 1.5% |
| Interquartile 25% (IQ1) | 0.87% | 1.3% |
| Interquartile 75% (IQ3) | 1.5% | 2.0% |
| Interquartile Range (IQR) | 0.66% | 0.72% |
| Standard Deviation (Sample) | 1.0% | 4.1% |
| Standard Deviation (Population) | 1.00% | 4.0% |
Similar Demographics by No Schooling Completed
Demographics Similar to Dutch West Indians by No Schooling Completed
In terms of no schooling completed, the demographic groups most similar to Dutch West Indians are Brazilian (2.1%, a difference of 0.050%), Egyptian (2.1%, a difference of 0.10%), Comanche (2.1%, a difference of 0.11%), Cheyenne (2.1%, a difference of 0.18%), and Albanian (2.1%, a difference of 0.33%).
| Demographics | Rating | Rank | No Schooling Completed |
| Immigrants | Spain | 66.4 /100 | #159 | Good 2.0% |
| Kenyans | 65.7 /100 | #160 | Good 2.0% |
| Ugandans | 64.6 /100 | #161 | Good 2.0% |
| Immigrants | Brazil | 63.8 /100 | #162 | Good 2.1% |
| Albanians | 62.2 /100 | #163 | Good 2.1% |
| Comanche | 60.7 /100 | #164 | Good 2.1% |
| Brazilians | 60.2 /100 | #165 | Good 2.1% |
| Dutch West Indians | 59.9 /100 | #166 | Average 2.1% |
| Egyptians | 59.2 /100 | #167 | Average 2.1% |
| Cheyenne | 58.6 /100 | #168 | Average 2.1% |
| Apache | 56.7 /100 | #169 | Average 2.1% |
| Argentineans | 56.0 /100 | #170 | Average 2.1% |
| Immigrants | Poland | 55.2 /100 | #171 | Average 2.1% |
| Immigrants | Argentina | 52.7 /100 | #172 | Average 2.1% |
| Immigrants | Belarus | 51.8 /100 | #173 | Average 2.1% |
Demographics Similar to Americans by No Schooling Completed
In terms of no schooling completed, the demographic groups most similar to Americans are Slavic (1.7%, a difference of 0.12%), Kiowa (1.6%, a difference of 0.19%), Tsimshian (1.7%, a difference of 0.29%), Austrian (1.6%, a difference of 0.35%), and Greek (1.6%, a difference of 0.66%).
| Demographics | Rating | Rank | No Schooling Completed |
| Creek | 99.8 /100 | #53 | Exceptional 1.6% |
| Crow | 99.8 /100 | #54 | Exceptional 1.6% |
| Greeks | 99.8 /100 | #55 | Exceptional 1.6% |
| Immigrants | North America | 99.8 /100 | #56 | Exceptional 1.6% |
| Austrians | 99.8 /100 | #57 | Exceptional 1.6% |
| Kiowa | 99.8 /100 | #58 | Exceptional 1.6% |
| Slavs | 99.8 /100 | #59 | Exceptional 1.7% |
| Americans | 99.8 /100 | #60 | Exceptional 1.7% |
| Tsimshian | 99.8 /100 | #61 | Exceptional 1.7% |
| Immigrants | Northern Europe | 99.8 /100 | #62 | Exceptional 1.7% |
| Russians | 99.8 /100 | #63 | Exceptional 1.7% |
| New Zealanders | 99.7 /100 | #64 | Exceptional 1.7% |
| Serbians | 99.7 /100 | #65 | Exceptional 1.7% |
| Canadians | 99.7 /100 | #66 | Exceptional 1.7% |
| Immigrants | Austria | 99.7 /100 | #67 | Exceptional 1.7% |