Cuban vs American No Schooling Completed
COMPARE
Cuban
American
No Schooling Completed
No Schooling Completed Comparison
Cubans
Americans
2.5%
NO SCHOOLING COMPLETED
0.2/ 100
METRIC RATING
271st/ 347
METRIC RANK
1.7%
NO SCHOOLING COMPLETED
99.8/ 100
METRIC RATING
60th/ 347
METRIC RANK
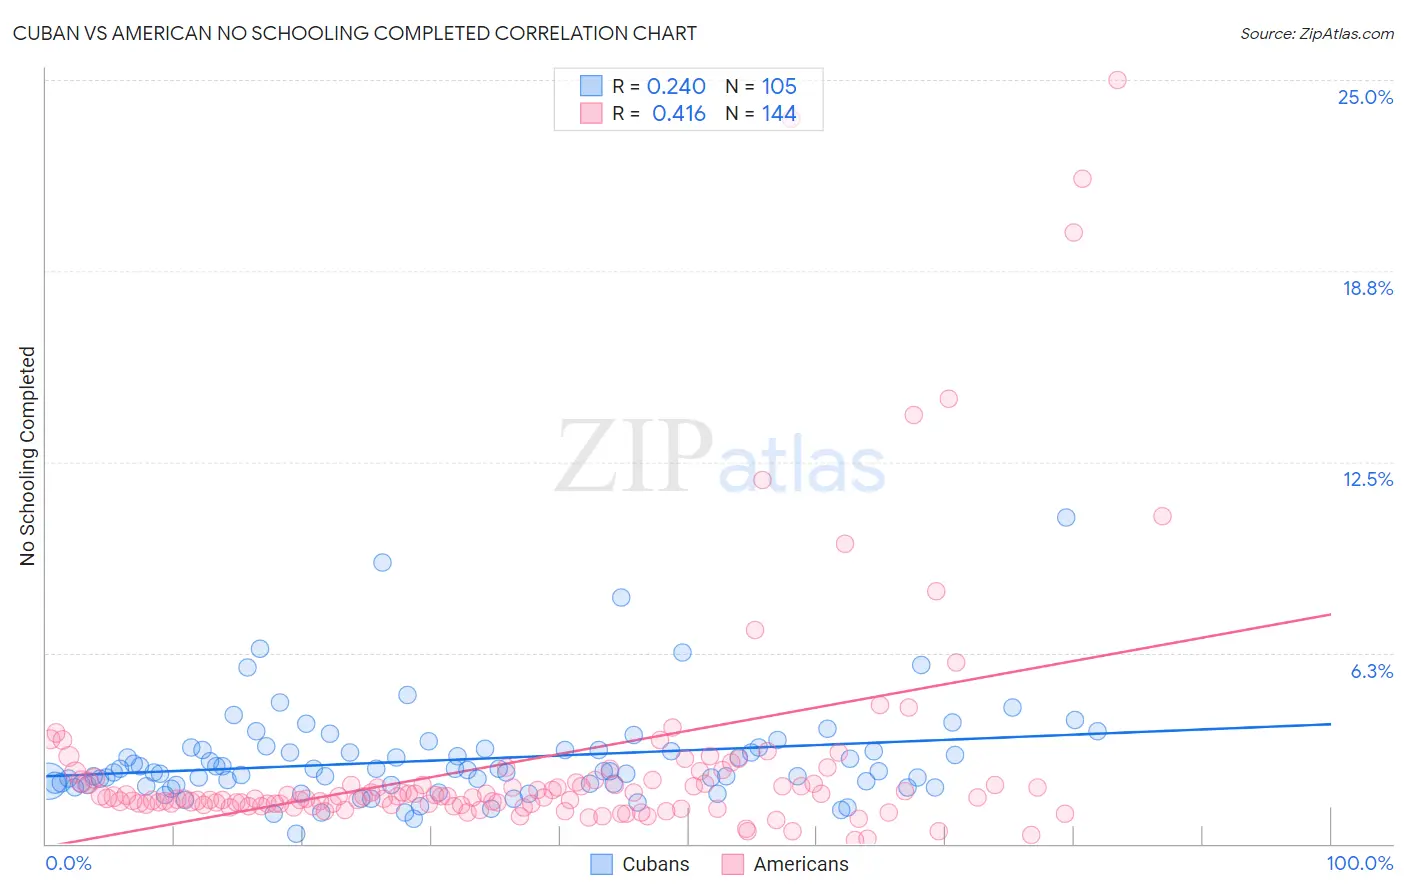
Cuban vs American No Schooling Completed Correlation Chart
The statistical analysis conducted on geographies consisting of 444,053,579 people shows a weak positive correlation between the proportion of Cubans and percentage of population with no schooling in the United States with a correlation coefficient (R) of 0.240 and weighted average of 2.5%. Similarly, the statistical analysis conducted on geographies consisting of 561,195,336 people shows a moderate positive correlation between the proportion of Americans and percentage of population with no schooling in the United States with a correlation coefficient (R) of 0.416 and weighted average of 1.7%, a difference of 52.2%.
No Schooling Completed Correlation Summary
| Measurement | Cuban | American |
| Minimum | 0.33% | 0.13% |
| Maximum | 10.7% | 25.0% |
| Range | 10.4% | 24.9% |
| Mean | 2.8% | 2.7% |
| Median | 2.4% | 1.5% |
| Interquartile 25% (IQ1) | 1.9% | 1.3% |
| Interquartile 75% (IQ3) | 3.1% | 2.0% |
| Interquartile Range (IQR) | 1.1% | 0.72% |
| Standard Deviation (Sample) | 1.6% | 4.1% |
| Standard Deviation (Population) | 1.6% | 4.0% |
Similar Demographics by No Schooling Completed
Demographics Similar to Cubans by No Schooling Completed
In terms of no schooling completed, the demographic groups most similar to Cubans are Immigrants from Peru (2.5%, a difference of 0.010%), Immigrants from Nigeria (2.5%, a difference of 0.090%), Immigrants from Bolivia (2.5%, a difference of 0.53%), Taiwanese (2.5%, a difference of 0.95%), and Yuman (2.5%, a difference of 1.2%).
| Demographics | Rating | Rank | No Schooling Completed |
| Indians (Asian) | 0.4 /100 | #264 | Tragic 2.5% |
| West Indians | 0.4 /100 | #265 | Tragic 2.5% |
| Fijians | 0.4 /100 | #266 | Tragic 2.5% |
| Yuman | 0.4 /100 | #267 | Tragic 2.5% |
| Taiwanese | 0.3 /100 | #268 | Tragic 2.5% |
| Immigrants | Nigeria | 0.2 /100 | #269 | Tragic 2.5% |
| Immigrants | Peru | 0.2 /100 | #270 | Tragic 2.5% |
| Cubans | 0.2 /100 | #271 | Tragic 2.5% |
| Immigrants | Bolivia | 0.2 /100 | #272 | Tragic 2.5% |
| Immigrants | Cameroon | 0.1 /100 | #273 | Tragic 2.5% |
| Ghanaians | 0.1 /100 | #274 | Tragic 2.6% |
| Immigrants | China | 0.1 /100 | #275 | Tragic 2.6% |
| Immigrants | Western Africa | 0.1 /100 | #276 | Tragic 2.6% |
| Immigrants | Philippines | 0.1 /100 | #277 | Tragic 2.6% |
| Immigrants | Uzbekistan | 0.1 /100 | #278 | Tragic 2.6% |
Demographics Similar to Americans by No Schooling Completed
In terms of no schooling completed, the demographic groups most similar to Americans are Slavic (1.7%, a difference of 0.12%), Kiowa (1.6%, a difference of 0.19%), Tsimshian (1.7%, a difference of 0.29%), Austrian (1.6%, a difference of 0.35%), and Greek (1.6%, a difference of 0.66%).
| Demographics | Rating | Rank | No Schooling Completed |
| Creek | 99.8 /100 | #53 | Exceptional 1.6% |
| Crow | 99.8 /100 | #54 | Exceptional 1.6% |
| Greeks | 99.8 /100 | #55 | Exceptional 1.6% |
| Immigrants | North America | 99.8 /100 | #56 | Exceptional 1.6% |
| Austrians | 99.8 /100 | #57 | Exceptional 1.6% |
| Kiowa | 99.8 /100 | #58 | Exceptional 1.6% |
| Slavs | 99.8 /100 | #59 | Exceptional 1.7% |
| Americans | 99.8 /100 | #60 | Exceptional 1.7% |
| Tsimshian | 99.8 /100 | #61 | Exceptional 1.7% |
| Immigrants | Northern Europe | 99.8 /100 | #62 | Exceptional 1.7% |
| Russians | 99.8 /100 | #63 | Exceptional 1.7% |
| New Zealanders | 99.7 /100 | #64 | Exceptional 1.7% |
| Serbians | 99.7 /100 | #65 | Exceptional 1.7% |
| Canadians | 99.7 /100 | #66 | Exceptional 1.7% |
| Immigrants | Austria | 99.7 /100 | #67 | Exceptional 1.7% |