Trinidadian and Tobagonian vs Indonesian Doctorate Degree
COMPARE
Trinidadian and Tobagonian
Indonesian
Doctorate Degree
Doctorate Degree Comparison
Trinidadians and Tobagonians
Indonesians
1.5%
DOCTORATE DEGREE
1.0/ 100
METRIC RATING
255th/ 347
METRIC RANK
1.6%
DOCTORATE DEGREE
2.8/ 100
METRIC RATING
236th/ 347
METRIC RANK
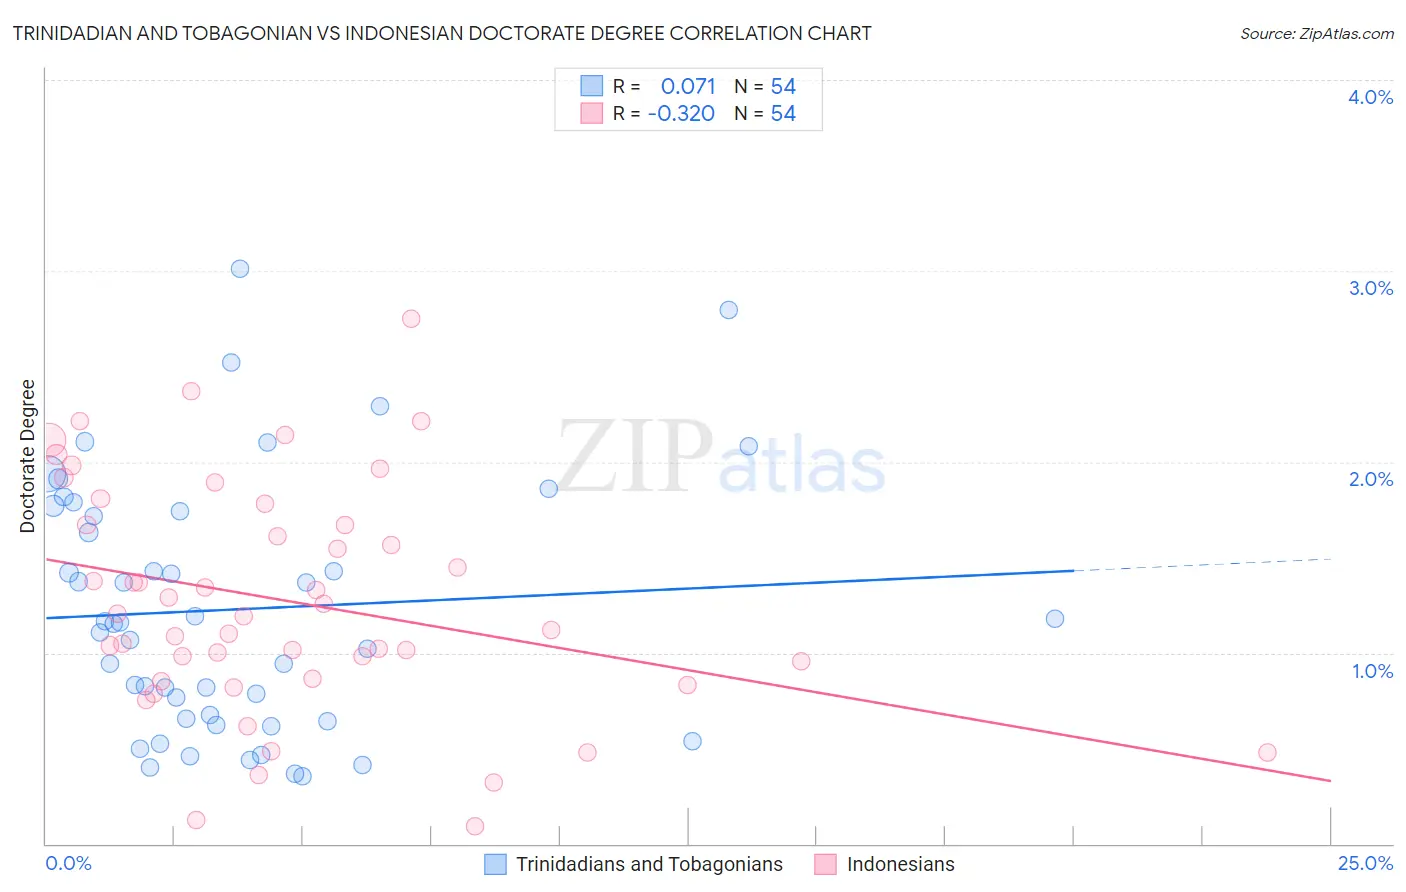
Trinidadian and Tobagonian vs Indonesian Doctorate Degree Correlation Chart
The statistical analysis conducted on geographies consisting of 218,914,311 people shows a slight positive correlation between the proportion of Trinidadians and Tobagonians and percentage of population with at least doctorate degree education in the United States with a correlation coefficient (R) of 0.071 and weighted average of 1.5%. Similarly, the statistical analysis conducted on geographies consisting of 162,227,737 people shows a mild negative correlation between the proportion of Indonesians and percentage of population with at least doctorate degree education in the United States with a correlation coefficient (R) of -0.320 and weighted average of 1.6%, a difference of 4.7%.
Doctorate Degree Correlation Summary
| Measurement | Trinidadian and Tobagonian | Indonesian |
| Minimum | 0.35% | 0.089% |
| Maximum | 3.0% | 2.7% |
| Range | 2.7% | 2.7% |
| Mean | 1.2% | 1.3% |
| Median | 1.2% | 1.2% |
| Interquartile 25% (IQ1) | 0.65% | 0.86% |
| Interquartile 75% (IQ3) | 1.7% | 1.7% |
| Interquartile Range (IQR) | 1.1% | 0.81% |
| Standard Deviation (Sample) | 0.66% | 0.60% |
| Standard Deviation (Population) | 0.65% | 0.59% |
Demographics Similar to Trinidadians and Tobagonians and Indonesians by Doctorate Degree
In terms of doctorate degree, the demographic groups most similar to Trinidadians and Tobagonians are Immigrants from Cambodia (1.5%, a difference of 0.010%), American (1.5%, a difference of 0.13%), Yuman (1.5%, a difference of 0.28%), Apache (1.5%, a difference of 1.2%), and Immigrants from Fiji (1.6%, a difference of 2.1%). Similarly, the demographic groups most similar to Indonesians are Iroquois (1.6%, a difference of 0.19%), Cree (1.6%, a difference of 0.29%), Immigrants from Congo (1.6%, a difference of 0.39%), West Indian (1.6%, a difference of 0.50%), and Immigrants from Panama (1.6%, a difference of 0.69%).
| Demographics | Rating | Rank | Doctorate Degree |
| Cree | 3.0 /100 | #235 | Tragic 1.6% |
| Indonesians | 2.8 /100 | #236 | Tragic 1.6% |
| Iroquois | 2.7 /100 | #237 | Tragic 1.6% |
| Immigrants | Congo | 2.6 /100 | #238 | Tragic 1.6% |
| West Indians | 2.5 /100 | #239 | Tragic 1.6% |
| Immigrants | Panama | 2.4 /100 | #240 | Tragic 1.6% |
| Cheyenne | 2.3 /100 | #241 | Tragic 1.6% |
| Ottawa | 2.2 /100 | #242 | Tragic 1.6% |
| Native Hawaiians | 2.1 /100 | #243 | Tragic 1.6% |
| French American Indians | 2.0 /100 | #244 | Tragic 1.6% |
| Delaware | 1.9 /100 | #245 | Tragic 1.6% |
| Hmong | 1.8 /100 | #246 | Tragic 1.6% |
| Comanche | 1.8 /100 | #247 | Tragic 1.6% |
| Africans | 1.8 /100 | #248 | Tragic 1.6% |
| Potawatomi | 1.6 /100 | #249 | Tragic 1.6% |
| Immigrants | Fiji | 1.6 /100 | #250 | Tragic 1.6% |
| Apache | 1.3 /100 | #251 | Tragic 1.5% |
| Yuman | 1.1 /100 | #252 | Tragic 1.5% |
| Americans | 1.0 /100 | #253 | Tragic 1.5% |
| Immigrants | Cambodia | 1.0 /100 | #254 | Tragic 1.5% |
| Trinidadians and Tobagonians | 1.0 /100 | #255 | Tragic 1.5% |