Lebanese vs Indonesian Doctorate Degree
COMPARE
Lebanese
Indonesian
Doctorate Degree
Doctorate Degree Comparison
Lebanese
Indonesians
2.1%
DOCTORATE DEGREE
96.0/ 100
METRIC RATING
117th/ 347
METRIC RANK
1.6%
DOCTORATE DEGREE
2.8/ 100
METRIC RATING
236th/ 347
METRIC RANK
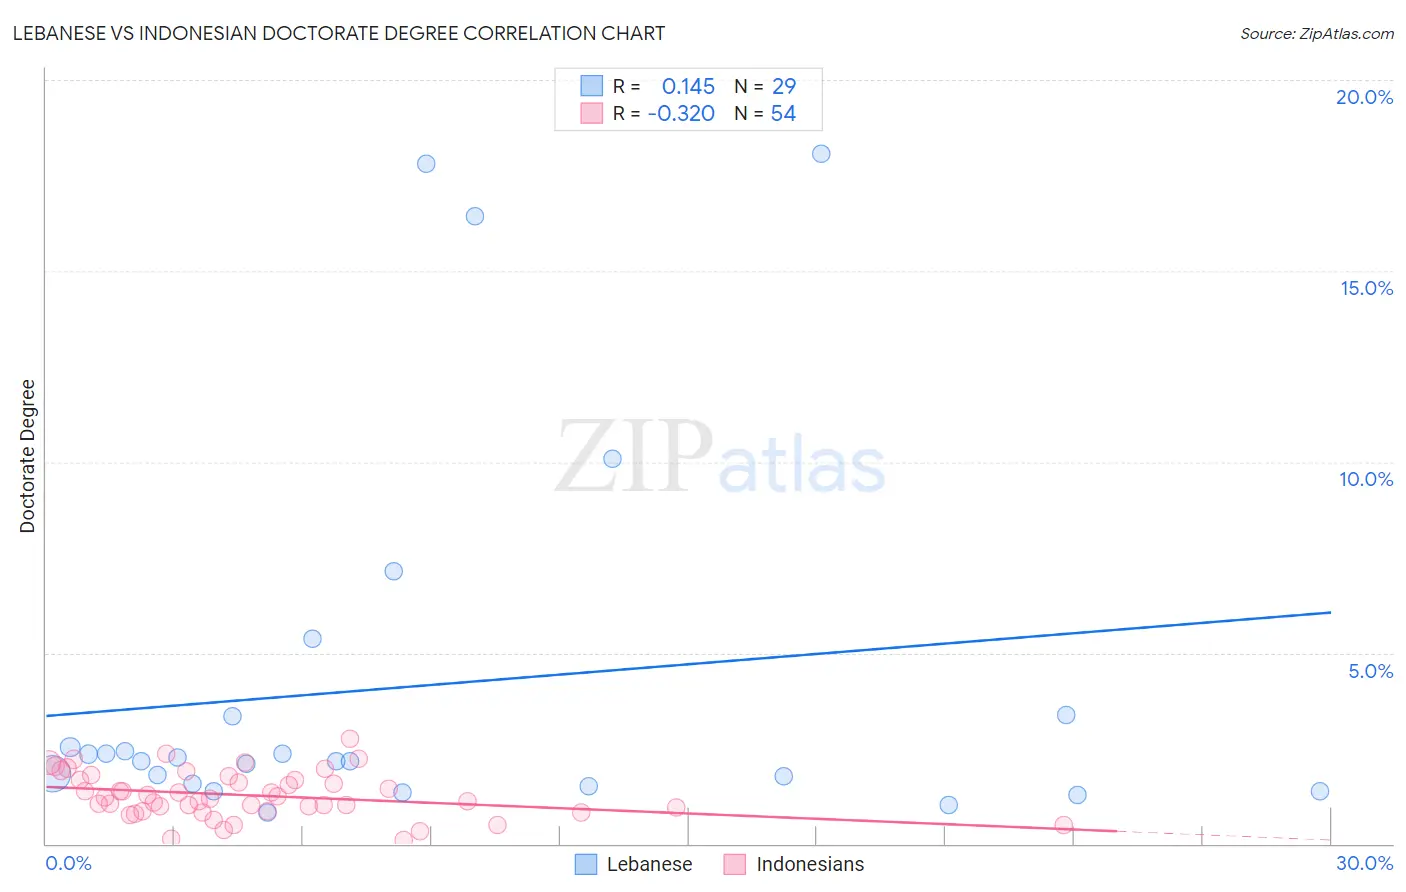
Lebanese vs Indonesian Doctorate Degree Correlation Chart
The statistical analysis conducted on geographies consisting of 398,305,554 people shows a poor positive correlation between the proportion of Lebanese and percentage of population with at least doctorate degree education in the United States with a correlation coefficient (R) of 0.145 and weighted average of 2.1%. Similarly, the statistical analysis conducted on geographies consisting of 162,227,737 people shows a mild negative correlation between the proportion of Indonesians and percentage of population with at least doctorate degree education in the United States with a correlation coefficient (R) of -0.320 and weighted average of 1.6%, a difference of 28.3%.
Doctorate Degree Correlation Summary
| Measurement | Lebanese | Indonesian |
| Minimum | 0.83% | 0.089% |
| Maximum | 18.1% | 2.7% |
| Range | 17.3% | 2.7% |
| Mean | 4.1% | 1.3% |
| Median | 2.2% | 1.2% |
| Interquartile 25% (IQ1) | 1.5% | 0.86% |
| Interquartile 75% (IQ3) | 3.3% | 1.7% |
| Interquartile Range (IQR) | 1.8% | 0.81% |
| Standard Deviation (Sample) | 5.0% | 0.60% |
| Standard Deviation (Population) | 4.9% | 0.59% |
Similar Demographics by Doctorate Degree
Demographics Similar to Lebanese by Doctorate Degree
In terms of doctorate degree, the demographic groups most similar to Lebanese are Icelander (2.1%, a difference of 0.040%), Maltese (2.1%, a difference of 0.17%), Pakistani (2.0%, a difference of 0.17%), Immigrants from Morocco (2.0%, a difference of 0.45%), and Taiwanese (2.1%, a difference of 0.64%).
| Demographics | Rating | Rank | Doctorate Degree |
| Brazilians | 97.2 /100 | #110 | Exceptional 2.1% |
| Immigrants | Pakistan | 97.1 /100 | #111 | Exceptional 2.1% |
| Syrians | 97.1 /100 | #112 | Exceptional 2.1% |
| Immigrants | Italy | 96.9 /100 | #113 | Exceptional 2.1% |
| Immigrants | Croatia | 96.8 /100 | #114 | Exceptional 2.1% |
| Taiwanese | 96.7 /100 | #115 | Exceptional 2.1% |
| Maltese | 96.2 /100 | #116 | Exceptional 2.1% |
| Lebanese | 96.0 /100 | #117 | Exceptional 2.1% |
| Icelanders | 96.0 /100 | #118 | Exceptional 2.1% |
| Pakistanis | 95.8 /100 | #119 | Exceptional 2.0% |
| Immigrants | Morocco | 95.5 /100 | #120 | Exceptional 2.0% |
| Immigrants | Jordan | 94.8 /100 | #121 | Exceptional 2.0% |
| Immigrants | Southern Europe | 94.7 /100 | #122 | Exceptional 2.0% |
| Croatians | 94.0 /100 | #123 | Exceptional 2.0% |
| Ute | 93.2 /100 | #124 | Exceptional 2.0% |
Demographics Similar to Indonesians by Doctorate Degree
In terms of doctorate degree, the demographic groups most similar to Indonesians are Iroquois (1.6%, a difference of 0.19%), Cree (1.6%, a difference of 0.29%), Immigrants from Congo (1.6%, a difference of 0.39%), Hopi (1.6%, a difference of 0.50%), and West Indian (1.6%, a difference of 0.50%).
| Demographics | Rating | Rank | Doctorate Degree |
| Colville | 4.7 /100 | #229 | Tragic 1.6% |
| Immigrants | Philippines | 4.3 /100 | #230 | Tragic 1.6% |
| Immigrants | North Macedonia | 3.9 /100 | #231 | Tragic 1.6% |
| Guamanians/Chamorros | 3.3 /100 | #232 | Tragic 1.6% |
| Barbadians | 3.3 /100 | #233 | Tragic 1.6% |
| Hopi | 3.2 /100 | #234 | Tragic 1.6% |
| Cree | 3.0 /100 | #235 | Tragic 1.6% |
| Indonesians | 2.8 /100 | #236 | Tragic 1.6% |
| Iroquois | 2.7 /100 | #237 | Tragic 1.6% |
| Immigrants | Congo | 2.6 /100 | #238 | Tragic 1.6% |
| West Indians | 2.5 /100 | #239 | Tragic 1.6% |
| Immigrants | Panama | 2.4 /100 | #240 | Tragic 1.6% |
| Cheyenne | 2.3 /100 | #241 | Tragic 1.6% |
| Ottawa | 2.2 /100 | #242 | Tragic 1.6% |
| Native Hawaiians | 2.1 /100 | #243 | Tragic 1.6% |