Trinidadian and Tobagonian vs Immigrants from India Doctorate Degree
COMPARE
Trinidadian and Tobagonian
Immigrants from India
Doctorate Degree
Doctorate Degree Comparison
Trinidadians and Tobagonians
Immigrants from India
1.5%
DOCTORATE DEGREE
1.0/ 100
METRIC RATING
255th/ 347
METRIC RANK
2.8%
DOCTORATE DEGREE
100.0/ 100
METRIC RATING
15th/ 347
METRIC RANK
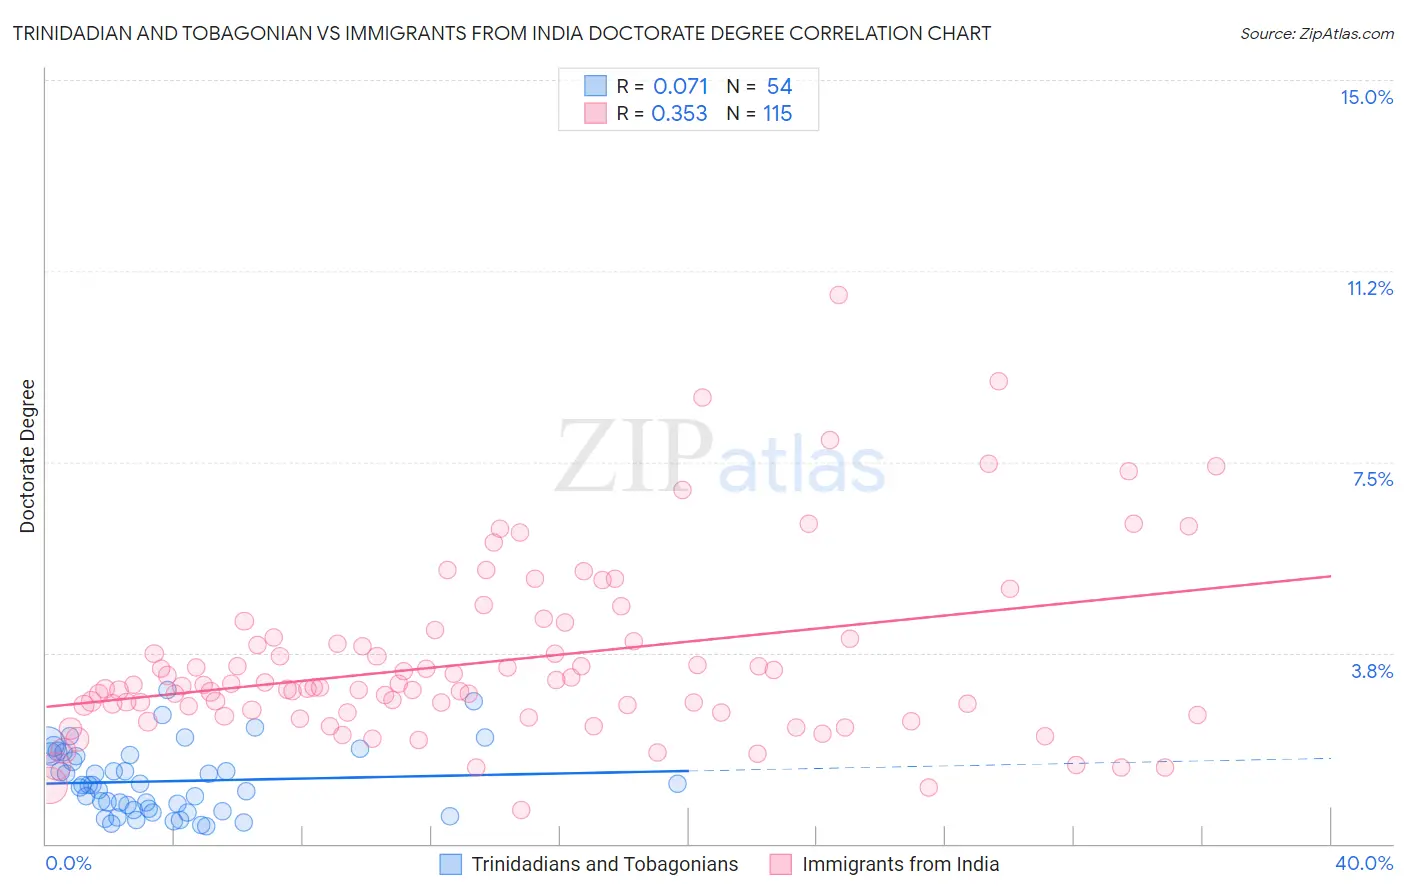
Trinidadian and Tobagonian vs Immigrants from India Doctorate Degree Correlation Chart
The statistical analysis conducted on geographies consisting of 218,914,311 people shows a slight positive correlation between the proportion of Trinidadians and Tobagonians and percentage of population with at least doctorate degree education in the United States with a correlation coefficient (R) of 0.071 and weighted average of 1.5%. Similarly, the statistical analysis conducted on geographies consisting of 430,386,279 people shows a mild positive correlation between the proportion of Immigrants from India and percentage of population with at least doctorate degree education in the United States with a correlation coefficient (R) of 0.353 and weighted average of 2.8%, a difference of 85.1%.
Doctorate Degree Correlation Summary
| Measurement | Trinidadian and Tobagonian | Immigrants from India |
| Minimum | 0.35% | 0.66% |
| Maximum | 3.0% | 10.8% |
| Range | 2.7% | 10.1% |
| Mean | 1.2% | 3.6% |
| Median | 1.2% | 3.1% |
| Interquartile 25% (IQ1) | 0.65% | 2.6% |
| Interquartile 75% (IQ3) | 1.7% | 4.0% |
| Interquartile Range (IQR) | 1.1% | 1.4% |
| Standard Deviation (Sample) | 0.66% | 1.7% |
| Standard Deviation (Population) | 0.65% | 1.7% |
Similar Demographics by Doctorate Degree
Demographics Similar to Trinidadians and Tobagonians by Doctorate Degree
In terms of doctorate degree, the demographic groups most similar to Trinidadians and Tobagonians are Immigrants from Cambodia (1.5%, a difference of 0.010%), Central American Indian (1.5%, a difference of 0.050%), American (1.5%, a difference of 0.13%), Chippewa (1.5%, a difference of 0.27%), and Yuman (1.5%, a difference of 0.28%).
| Demographics | Rating | Rank | Doctorate Degree |
| Africans | 1.8 /100 | #248 | Tragic 1.6% |
| Potawatomi | 1.6 /100 | #249 | Tragic 1.6% |
| Immigrants | Fiji | 1.6 /100 | #250 | Tragic 1.6% |
| Apache | 1.3 /100 | #251 | Tragic 1.5% |
| Yuman | 1.1 /100 | #252 | Tragic 1.5% |
| Americans | 1.0 /100 | #253 | Tragic 1.5% |
| Immigrants | Cambodia | 1.0 /100 | #254 | Tragic 1.5% |
| Trinidadians and Tobagonians | 1.0 /100 | #255 | Tragic 1.5% |
| Central American Indians | 1.0 /100 | #256 | Tragic 1.5% |
| Chippewa | 0.9 /100 | #257 | Tragic 1.5% |
| Immigrants | West Indies | 0.9 /100 | #258 | Tragic 1.5% |
| Liberians | 0.9 /100 | #259 | Tragic 1.5% |
| Japanese | 0.9 /100 | #260 | Tragic 1.5% |
| Immigrants | Portugal | 0.8 /100 | #261 | Tragic 1.5% |
| Chickasaw | 0.7 /100 | #262 | Tragic 1.5% |
Demographics Similar to Immigrants from India by Doctorate Degree
In terms of doctorate degree, the demographic groups most similar to Immigrants from India are Eastern European (2.8%, a difference of 0.32%), Immigrants from Australia (2.8%, a difference of 1.0%), Immigrants from France (2.9%, a difference of 1.1%), Immigrants from Sweden (2.9%, a difference of 1.2%), and Immigrants from Sri Lanka (2.8%, a difference of 1.3%).
| Demographics | Rating | Rank | Doctorate Degree |
| Immigrants | Israel | 100.0 /100 | #8 | Exceptional 3.0% |
| Immigrants | Iran | 100.0 /100 | #9 | Exceptional 3.0% |
| Immigrants | Eastern Asia | 100.0 /100 | #10 | Exceptional 3.0% |
| Indians (Asian) | 100.0 /100 | #11 | Exceptional 2.9% |
| Immigrants | Belgium | 100.0 /100 | #12 | Exceptional 2.9% |
| Immigrants | Sweden | 100.0 /100 | #13 | Exceptional 2.9% |
| Immigrants | France | 100.0 /100 | #14 | Exceptional 2.9% |
| Immigrants | India | 100.0 /100 | #15 | Exceptional 2.8% |
| Eastern Europeans | 100.0 /100 | #16 | Exceptional 2.8% |
| Immigrants | Australia | 100.0 /100 | #17 | Exceptional 2.8% |
| Immigrants | Sri Lanka | 100.0 /100 | #18 | Exceptional 2.8% |
| Immigrants | Japan | 100.0 /100 | #19 | Exceptional 2.8% |
| Immigrants | Hong Kong | 100.0 /100 | #20 | Exceptional 2.8% |
| Thais | 100.0 /100 | #21 | Exceptional 2.8% |
| Mongolians | 100.0 /100 | #22 | Exceptional 2.8% |