Immigrants from Bulgaria vs Indonesian Doctorate Degree
COMPARE
Immigrants from Bulgaria
Indonesian
Doctorate Degree
Doctorate Degree Comparison
Immigrants from Bulgaria
Indonesians
2.3%
DOCTORATE DEGREE
99.8/ 100
METRIC RATING
73rd/ 347
METRIC RANK
1.6%
DOCTORATE DEGREE
2.8/ 100
METRIC RATING
236th/ 347
METRIC RANK
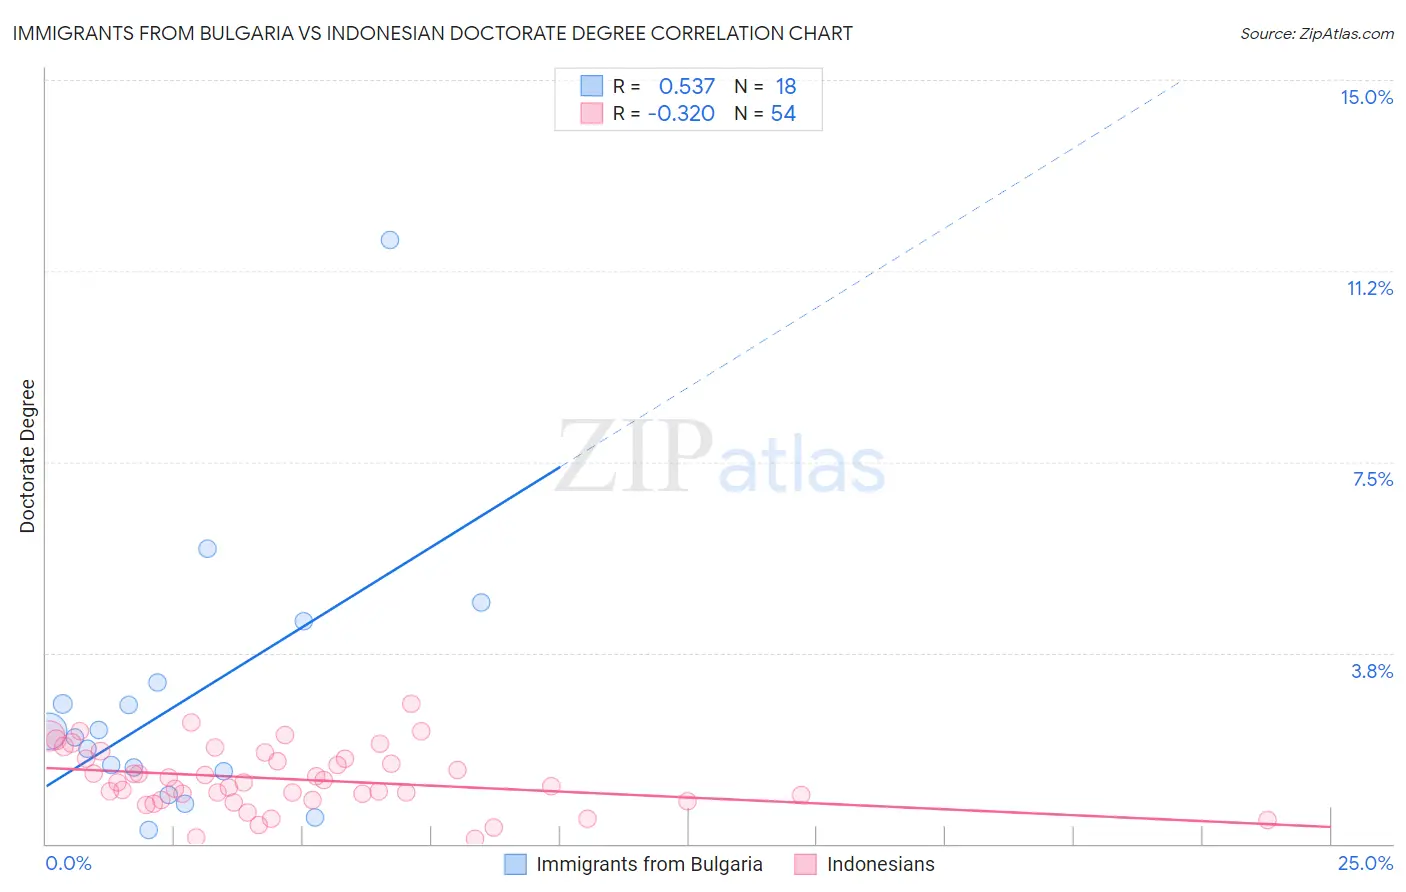
Immigrants from Bulgaria vs Indonesian Doctorate Degree Correlation Chart
The statistical analysis conducted on geographies consisting of 172,295,374 people shows a substantial positive correlation between the proportion of Immigrants from Bulgaria and percentage of population with at least doctorate degree education in the United States with a correlation coefficient (R) of 0.537 and weighted average of 2.3%. Similarly, the statistical analysis conducted on geographies consisting of 162,227,737 people shows a mild negative correlation between the proportion of Indonesians and percentage of population with at least doctorate degree education in the United States with a correlation coefficient (R) of -0.320 and weighted average of 1.6%, a difference of 40.8%.
Doctorate Degree Correlation Summary
| Measurement | Immigrants from Bulgaria | Indonesian |
| Minimum | 0.26% | 0.089% |
| Maximum | 11.8% | 2.7% |
| Range | 11.6% | 2.7% |
| Mean | 2.8% | 1.3% |
| Median | 2.2% | 1.2% |
| Interquartile 25% (IQ1) | 1.4% | 0.86% |
| Interquartile 75% (IQ3) | 3.2% | 1.7% |
| Interquartile Range (IQR) | 1.7% | 0.81% |
| Standard Deviation (Sample) | 2.7% | 0.60% |
| Standard Deviation (Population) | 2.6% | 0.59% |
Similar Demographics by Doctorate Degree
Demographics Similar to Immigrants from Bulgaria by Doctorate Degree
In terms of doctorate degree, the demographic groups most similar to Immigrants from Bulgaria are Immigrants from Canada (2.3%, a difference of 0.080%), Immigrants from North America (2.2%, a difference of 0.14%), Lithuanian (2.3%, a difference of 0.24%), Immigrants from Bolivia (2.3%, a difference of 0.24%), and Immigrants from Western Asia (2.2%, a difference of 0.24%).
| Demographics | Rating | Rank | Doctorate Degree |
| Argentineans | 99.9 /100 | #66 | Exceptional 2.3% |
| Zimbabweans | 99.8 /100 | #67 | Exceptional 2.3% |
| Immigrants | Kazakhstan | 99.8 /100 | #68 | Exceptional 2.3% |
| Carpatho Rusyns | 99.8 /100 | #69 | Exceptional 2.3% |
| Lithuanians | 99.8 /100 | #70 | Exceptional 2.3% |
| Immigrants | Bolivia | 99.8 /100 | #71 | Exceptional 2.3% |
| Immigrants | Canada | 99.8 /100 | #72 | Exceptional 2.3% |
| Immigrants | Bulgaria | 99.8 /100 | #73 | Exceptional 2.3% |
| Immigrants | North America | 99.8 /100 | #74 | Exceptional 2.2% |
| Immigrants | Western Asia | 99.8 /100 | #75 | Exceptional 2.2% |
| Immigrants | Hungary | 99.8 /100 | #76 | Exceptional 2.2% |
| Immigrants | Lebanon | 99.8 /100 | #77 | Exceptional 2.2% |
| Immigrants | Belarus | 99.7 /100 | #78 | Exceptional 2.2% |
| Northern Europeans | 99.7 /100 | #79 | Exceptional 2.2% |
| Ugandans | 99.7 /100 | #80 | Exceptional 2.2% |
Demographics Similar to Indonesians by Doctorate Degree
In terms of doctorate degree, the demographic groups most similar to Indonesians are Iroquois (1.6%, a difference of 0.19%), Cree (1.6%, a difference of 0.29%), Immigrants from Congo (1.6%, a difference of 0.39%), Hopi (1.6%, a difference of 0.50%), and West Indian (1.6%, a difference of 0.50%).
| Demographics | Rating | Rank | Doctorate Degree |
| Colville | 4.7 /100 | #229 | Tragic 1.6% |
| Immigrants | Philippines | 4.3 /100 | #230 | Tragic 1.6% |
| Immigrants | North Macedonia | 3.9 /100 | #231 | Tragic 1.6% |
| Guamanians/Chamorros | 3.3 /100 | #232 | Tragic 1.6% |
| Barbadians | 3.3 /100 | #233 | Tragic 1.6% |
| Hopi | 3.2 /100 | #234 | Tragic 1.6% |
| Cree | 3.0 /100 | #235 | Tragic 1.6% |
| Indonesians | 2.8 /100 | #236 | Tragic 1.6% |
| Iroquois | 2.7 /100 | #237 | Tragic 1.6% |
| Immigrants | Congo | 2.6 /100 | #238 | Tragic 1.6% |
| West Indians | 2.5 /100 | #239 | Tragic 1.6% |
| Immigrants | Panama | 2.4 /100 | #240 | Tragic 1.6% |
| Cheyenne | 2.3 /100 | #241 | Tragic 1.6% |
| Ottawa | 2.2 /100 | #242 | Tragic 1.6% |
| Native Hawaiians | 2.1 /100 | #243 | Tragic 1.6% |