Trinidadian and Tobagonian vs Peruvian Doctorate Degree
COMPARE
Trinidadian and Tobagonian
Peruvian
Doctorate Degree
Doctorate Degree Comparison
Trinidadians and Tobagonians
Peruvians
1.5%
DOCTORATE DEGREE
1.0/ 100
METRIC RATING
255th/ 347
METRIC RANK
1.8%
DOCTORATE DEGREE
34.4/ 100
METRIC RATING
186th/ 347
METRIC RANK
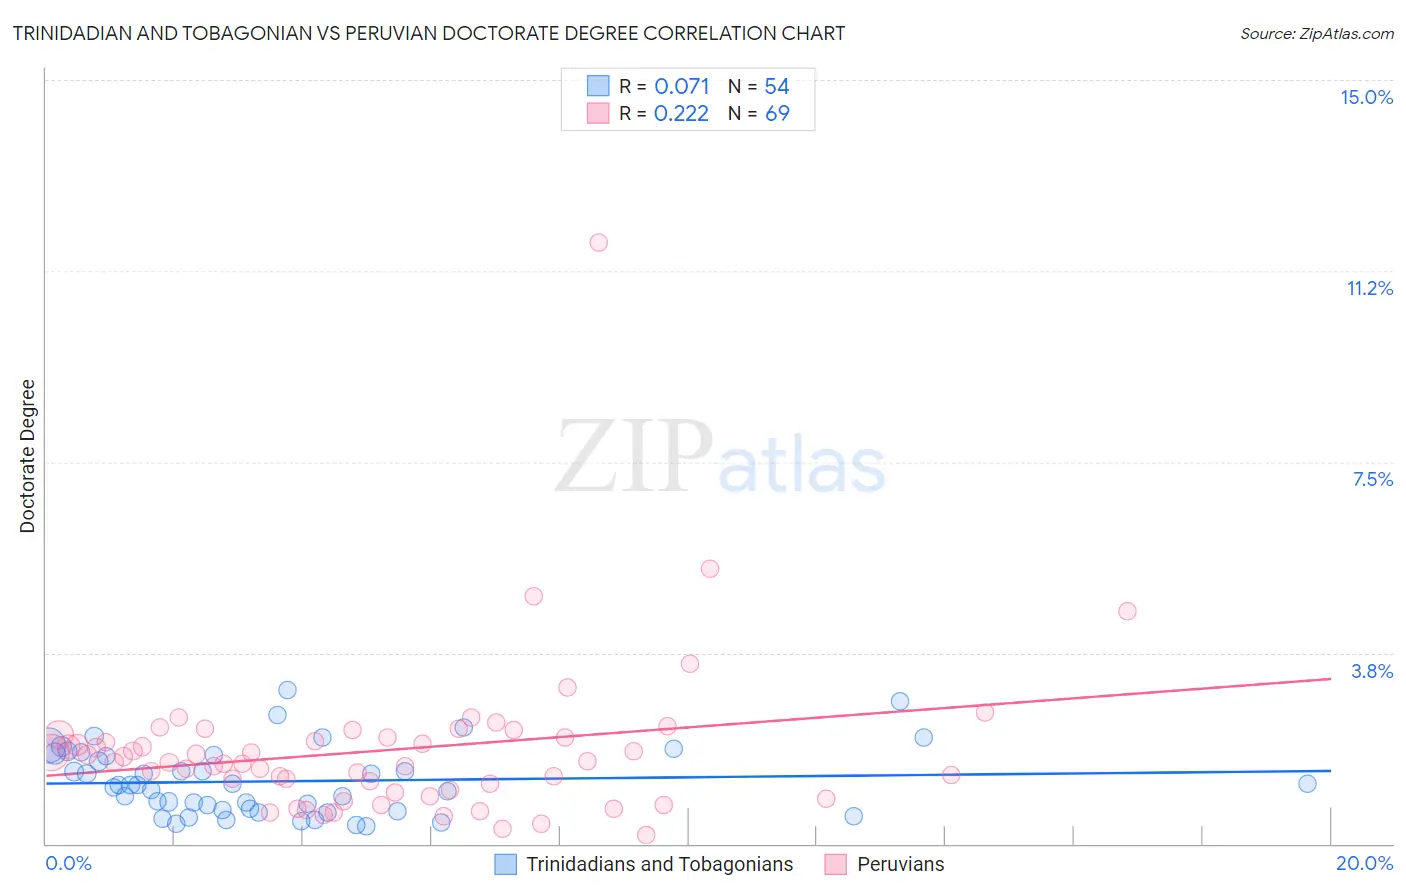
Trinidadian and Tobagonian vs Peruvian Doctorate Degree Correlation Chart
The statistical analysis conducted on geographies consisting of 218,914,311 people shows a slight positive correlation between the proportion of Trinidadians and Tobagonians and percentage of population with at least doctorate degree education in the United States with a correlation coefficient (R) of 0.071 and weighted average of 1.5%. Similarly, the statistical analysis conducted on geographies consisting of 360,973,497 people shows a weak positive correlation between the proportion of Peruvians and percentage of population with at least doctorate degree education in the United States with a correlation coefficient (R) of 0.222 and weighted average of 1.8%, a difference of 17.4%.
Doctorate Degree Correlation Summary
| Measurement | Trinidadian and Tobagonian | Peruvian |
| Minimum | 0.35% | 0.17% |
| Maximum | 3.0% | 11.8% |
| Range | 2.7% | 11.6% |
| Mean | 1.2% | 1.8% |
| Median | 1.2% | 1.6% |
| Interquartile 25% (IQ1) | 0.65% | 1.0% |
| Interquartile 75% (IQ3) | 1.7% | 2.1% |
| Interquartile Range (IQR) | 1.1% | 1.1% |
| Standard Deviation (Sample) | 0.66% | 1.6% |
| Standard Deviation (Population) | 0.65% | 1.5% |
Similar Demographics by Doctorate Degree
Demographics Similar to Trinidadians and Tobagonians by Doctorate Degree
In terms of doctorate degree, the demographic groups most similar to Trinidadians and Tobagonians are Immigrants from Cambodia (1.5%, a difference of 0.010%), Central American Indian (1.5%, a difference of 0.050%), American (1.5%, a difference of 0.13%), Chippewa (1.5%, a difference of 0.27%), and Yuman (1.5%, a difference of 0.28%).
| Demographics | Rating | Rank | Doctorate Degree |
| Africans | 1.8 /100 | #248 | Tragic 1.6% |
| Potawatomi | 1.6 /100 | #249 | Tragic 1.6% |
| Immigrants | Fiji | 1.6 /100 | #250 | Tragic 1.6% |
| Apache | 1.3 /100 | #251 | Tragic 1.5% |
| Yuman | 1.1 /100 | #252 | Tragic 1.5% |
| Americans | 1.0 /100 | #253 | Tragic 1.5% |
| Immigrants | Cambodia | 1.0 /100 | #254 | Tragic 1.5% |
| Trinidadians and Tobagonians | 1.0 /100 | #255 | Tragic 1.5% |
| Central American Indians | 1.0 /100 | #256 | Tragic 1.5% |
| Chippewa | 0.9 /100 | #257 | Tragic 1.5% |
| Immigrants | West Indies | 0.9 /100 | #258 | Tragic 1.5% |
| Liberians | 0.9 /100 | #259 | Tragic 1.5% |
| Japanese | 0.9 /100 | #260 | Tragic 1.5% |
| Immigrants | Portugal | 0.8 /100 | #261 | Tragic 1.5% |
| Chickasaw | 0.7 /100 | #262 | Tragic 1.5% |
Demographics Similar to Peruvians by Doctorate Degree
In terms of doctorate degree, the demographic groups most similar to Peruvians are Czechoslovakian (1.8%, a difference of 0.23%), Slovak (1.8%, a difference of 0.32%), German (1.8%, a difference of 0.68%), French Canadian (1.8%, a difference of 0.72%), and Immigrants from Costa Rica (1.8%, a difference of 0.73%).
| Demographics | Rating | Rank | Doctorate Degree |
| Ghanaians | 48.3 /100 | #179 | Average 1.8% |
| Scandinavians | 48.0 /100 | #180 | Average 1.8% |
| Immigrants | Immigrants | 46.2 /100 | #181 | Average 1.8% |
| Immigrants | Afghanistan | 44.3 /100 | #182 | Average 1.8% |
| Finns | 42.1 /100 | #183 | Average 1.8% |
| Nigerians | 39.9 /100 | #184 | Fair 1.8% |
| Slovaks | 36.4 /100 | #185 | Fair 1.8% |
| Peruvians | 34.4 /100 | #186 | Fair 1.8% |
| Czechoslovakians | 33.0 /100 | #187 | Fair 1.8% |
| Germans | 30.5 /100 | #188 | Fair 1.8% |
| French Canadians | 30.2 /100 | #189 | Fair 1.8% |
| Immigrants | Costa Rica | 30.2 /100 | #190 | Fair 1.8% |
| South Americans | 29.5 /100 | #191 | Fair 1.8% |
| Dutch | 27.4 /100 | #192 | Fair 1.8% |
| German Russians | 27.1 /100 | #193 | Fair 1.8% |