Okinawan vs Indonesian Doctorate Degree

COMPARE

Okinawan
Race
Ancestry
AfghanAfricanAlaska NativeAlaskan AthabascanAlbanianAleutAlsatianAmericanApacheArabArapahoArgentineanArmenianAssyrian/Chaldean/SyriacAustralianAustrianBahamianBangladeshiBarbadianBasqueBelgianBelizeanBermudanBhutaneseBlackfeetBolivianBrazilianBritishBritish West IndianBulgarianBurmeseCajunCambodianCanadianCape VerdeanCarpatho RusynCelticCentral AmericanCentral American IndianCherokeeCheyenneChickasawChileanChineseChippewaChoctawColombianColvilleComancheCosta RicanCreeCreekCroatianCrowCubanCypriotCzechCzechoslovakianDanishDelawareDominicanDutchDutch West IndianEastern EuropeanEcuadorianEgyptianEnglishEstonianEthiopianEuropeanFijianFilipinoFinnishFrenchFrench American IndianFrench CanadianGermanGerman RussianGhanaianGreekGuamanian/ChamorroGuatemalanGuyaneseHaitianHmongHonduranHopiHoumaHungarianIcelanderIndian (Asian)InupiatIranianIraqiIrishIroquoisIsraeliItalianJamaicanJapaneseJordanianKenyanKiowaKoreanLaotianLatvianLebaneseLiberianLithuanianLumbeeLuxembourgerMacedonianMalaysianMalteseMarshalleseMenomineeMexicanMexican American IndianMongolianMoroccanNative HawaiianNavajoNepaleseNew ZealanderNicaraguanNigerianNorthern EuropeanNorwegianOkinawanOsageOttawaPaiutePakistaniPalestinianPanamanianParaguayanPennsylvania GermanPeruvianPimaPolishPortuguesePotawatomiPuebloPuerto RicanPuget Sound SalishRomanianRussianSalvadoranSamoanScandinavianScotch-IrishScottishSeminoleSenegaleseSerbianShoshoneSierra LeoneanSiouxSlavicSlovakSloveneSomaliSouth AfricanSouth AmericanSouth American IndianSoviet UnionSpaniardSpanishSpanish AmericanSpanish American IndianSri LankanSubsaharan AfricanSudaneseSwedishSwissSyrianTaiwaneseThaiTlingit-HaidaTohono O'OdhamTonganTrinidadian and TobagonianTsimshianTurkishU.S. Virgin IslanderUgandanUkrainianUruguayanUteVenezuelanVietnameseWelshWest IndianYakamaYaquiYugoslavianYumanYup'ikZimbabwean
Immigration
NonimmigrantsImmigrantsAfghanistanAfricaAlbaniaArgentinaArmeniaAsiaAustraliaAustriaBahamasBangladeshBarbadosBelarusBelgiumBelizeBoliviaBosnia and HerzegovinaBrazilBulgariaBurma/MyanmarCabo VerdeCambodiaCameroonCanadaCaribbeanCentral AmericaChileChinaColombiaCongoCosta RicaCroatiaCubaCzechoslovakiaDenmarkDominicaDominican RepublicEastern AfricaEastern AsiaEastern EuropeEcuadorEgyptEl SalvadorEnglandEritreaEthiopiaEuropeFijiFranceGermanyGhanaGreeceGrenadaGuatemalaGuyanaHaitiHondurasHong KongHungaryIndiaIndonesiaIranIraqIrelandIsraelItalyJamaicaJapanJordanKazakhstanKenyaKoreaKuwaitLaosLatin AmericaLatviaLebanonLiberiaLithuaniaMalaysiaMexicoMicronesiaMiddle AfricaMoldovaMoroccoNepalNetherlandsNicaraguaNigeriaNorth AmericaNorth MacedoniaNorthern AfricaNorthern EuropeNorwayOceaniaPakistanPanamaPeruPhilippinesPolandPortugalRomaniaRussiaSaudi ArabiaScotlandSenegalSerbiaSierra LeoneSingaporeSomaliaSouth AfricaSouth AmericaSouth Central AsiaSouth Eastern AsiaSouthern EuropeSpainSri LankaSt. Vincent and the GrenadinesSudanSwedenSwitzerlandSyriaTaiwanThailandTrinidad and TobagoTurkeyUgandaUkraineUruguayUzbekistanVenezuelaVietnamWest IndiesWestern AfricaWestern AsiaWestern EuropeYemenZaireZimbabweAzores
Indonesian
Race
Ancestry
AfghanAfricanAlaska NativeAlaskan AthabascanAlbanianAleutAlsatianAmericanApacheArabArapahoArgentineanArmenianAssyrian/Chaldean/SyriacAustralianAustrianBahamianBangladeshiBarbadianBasqueBelgianBelizeanBermudanBhutaneseBlackfeetBolivianBrazilianBritishBritish West IndianBulgarianBurmeseCajunCambodianCanadianCape VerdeanCarpatho RusynCelticCentral AmericanCentral American IndianCherokeeCheyenneChickasawChileanChineseChippewaChoctawColombianColvilleComancheCosta RicanCreeCreekCroatianCrowCubanCypriotCzechCzechoslovakianDanishDelawareDominicanDutchDutch West IndianEastern EuropeanEcuadorianEgyptianEnglishEstonianEthiopianEuropeanFijianFilipinoFinnishFrenchFrench American IndianFrench CanadianGermanGerman RussianGhanaianGreekGuamanian/ChamorroGuatemalanGuyaneseHaitianHmongHonduranHopiHoumaHungarianIcelanderIndian (Asian)IndonesianInupiatIranianIraqiIrishIroquoisIsraeliItalianJamaicanJapaneseJordanianKenyanKiowaKoreanLaotianLatvianLebaneseLiberianLithuanianLumbeeLuxembourgerMacedonianMalaysianMalteseMarshalleseMenomineeMexicanMexican American IndianMongolianMoroccanNative HawaiianNavajoNepaleseNew ZealanderNicaraguanNigerianNorthern EuropeanNorwegianOsageOttawaPaiutePakistaniPalestinianPanamanianParaguayanPennsylvania GermanPeruvianPimaPolishPortuguesePotawatomiPuebloPuerto RicanPuget Sound SalishRomanianRussianSalvadoranSamoanScandinavianScotch-IrishScottishSeminoleSenegaleseSerbianShoshoneSierra LeoneanSiouxSlavicSlovakSloveneSomaliSouth AfricanSouth AmericanSouth American IndianSoviet UnionSpaniardSpanishSpanish AmericanSpanish American IndianSri LankanSubsaharan AfricanSudaneseSwedishSwissSyrianTaiwaneseThaiTlingit-HaidaTohono O'OdhamTonganTrinidadian and TobagonianTsimshianTurkishU.S. Virgin IslanderUgandanUkrainianUruguayanUteVenezuelanVietnameseWelshWest IndianYakamaYaquiYugoslavianYumanYup'ikZimbabwean
Immigration
NonimmigrantsImmigrantsAfghanistanAfricaAlbaniaArgentinaArmeniaAsiaAustraliaAustriaBahamasBangladeshBarbadosBelarusBelgiumBelizeBoliviaBosnia and HerzegovinaBrazilBulgariaBurma/MyanmarCabo VerdeCambodiaCameroonCanadaCaribbeanCentral AmericaChileChinaColombiaCongoCosta RicaCroatiaCubaCzechoslovakiaDenmarkDominicaDominican RepublicEastern AfricaEastern AsiaEastern EuropeEcuadorEgyptEl SalvadorEnglandEritreaEthiopiaEuropeFijiFranceGermanyGhanaGreeceGrenadaGuatemalaGuyanaHaitiHondurasHong KongHungaryIndiaIndonesiaIranIraqIrelandIsraelItalyJamaicaJapanJordanKazakhstanKenyaKoreaKuwaitLaosLatin AmericaLatviaLebanonLiberiaLithuaniaMalaysiaMexicoMicronesiaMiddle AfricaMoldovaMoroccoNepalNetherlandsNicaraguaNigeriaNorth AmericaNorth MacedoniaNorthern AfricaNorthern EuropeNorwayOceaniaPakistanPanamaPeruPhilippinesPolandPortugalRomaniaRussiaSaudi ArabiaScotlandSenegalSerbiaSierra LeoneSingaporeSomaliaSouth AfricaSouth AmericaSouth Central AsiaSouth Eastern AsiaSouthern EuropeSpainSri LankaSt. Vincent and the GrenadinesSudanSwedenSwitzerlandSyriaTaiwanThailandTrinidad and TobagoTurkeyUgandaUkraineUruguayUzbekistanVenezuelaVietnamWest IndiesWestern AfricaWestern AsiaWestern EuropeYemenZaireZimbabweAzores
Doctorate Degree
Income
Poverty
Unemployment
Labor Participation
Family Structure
Vehicle Availability
Education Level
Disability

Doctorate Degree Comparison

Okinawans

Indonesians

Exceptional
Tragic
3.3%
DOCTORATE DEGREE
100.0/ 100
METRIC RATING
3rd/ 347
METRIC RANK
1.6%
DOCTORATE DEGREE
2.8/ 100
METRIC RATING
236th/ 347
METRIC RANK

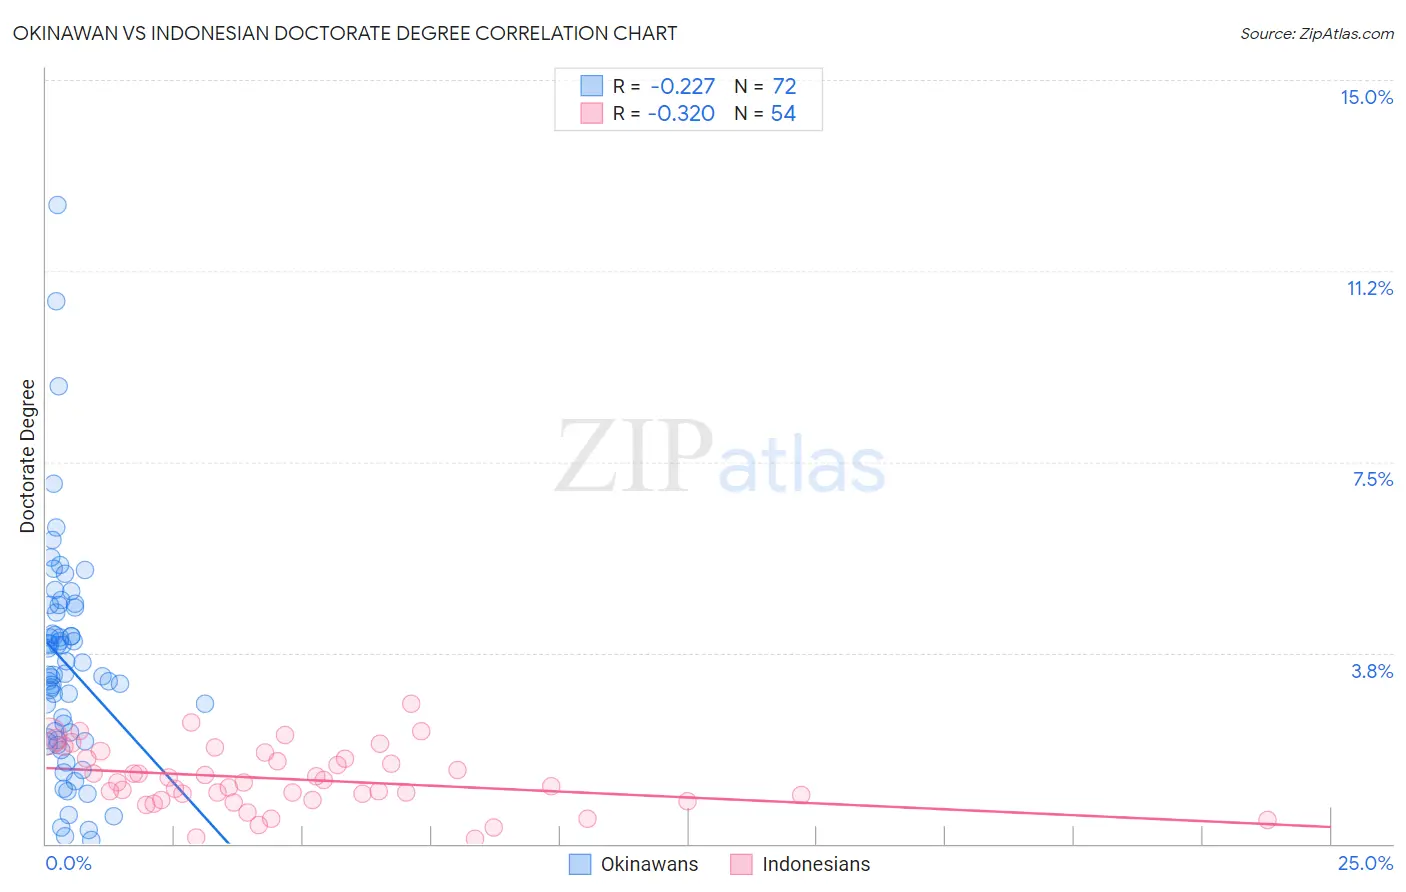
Okinawan vs Indonesian Doctorate Degree Correlation Chart

The statistical analysis conducted on geographies consisting of 73,671,875 people shows a weak negative correlation between the proportion of Okinawans and percentage of population with at least doctorate degree education in the United States with a correlation coefficient (R) of -0.227 and weighted average of 3.3%. Similarly, the statistical analysis conducted on geographies consisting of 162,227,737 people shows a mild negative correlation between the proportion of Indonesians and percentage of population with at least doctorate degree education in the United States with a correlation coefficient (R) of -0.320 and weighted average of 1.6%, a difference of 105.0%.
Okinawan vs Indonesian Doctorate Degree

Doctorate Degree Correlation Summary

MeasurementOkinawanIndonesian
Minimum0.067%0.089%
Maximum12.6%2.7%
Range12.5%2.7%
Mean3.5%1.3%
Median3.3%1.2%
Interquartile 25% (IQ1)2.0%0.86%
Interquartile 75% (IQ3)4.6%1.7%
Interquartile Range (IQR)2.5%0.81%
Standard Deviation (Sample)2.2%0.60%
Standard Deviation (Population)2.2%0.59%

Similar Demographics by Doctorate Degree

Demographics Similar to Okinawans by Doctorate Degree

In terms of doctorate degree, the demographic groups most similar to Okinawans are Immigrants from Taiwan (3.2%, a difference of 2.6%), Iranian (3.1%, a difference of 4.2%), Filipino (3.4%, a difference of 4.7%), Immigrants from Switzerland (3.1%, a difference of 6.2%), and Immigrants from China (3.1%, a difference of 6.3%).
DemographicsRating | RankDoctorate Degree
Immigrants | Singapore
100.0
/100
|
#1
Exceptional
3.7%
Filipinos
100.0
/100
|
#2
Exceptional
3.4%
Okinawans
100.0
/100
|
#3
Exceptional
3.3%
Immigrants | Taiwan
100.0
/100
|
#4
Exceptional
3.2%
Iranians
100.0
/100
|
#5
Exceptional
3.1%
Immigrants | Switzerland
100.0
/100
|
#6
Exceptional
3.1%
Immigrants | China
100.0
/100
|
#7
Exceptional
3.1%
Immigrants | Israel
100.0
/100
|
#8
Exceptional
3.0%
Immigrants | Iran
100.0
/100
|
#9
Exceptional
3.0%
Immigrants | Eastern Asia
100.0
/100
|
#10
Exceptional
3.0%
Indians (Asian)
100.0
/100
|
#11
Exceptional
2.9%
Immigrants | Belgium
100.0
/100
|
#12
Exceptional
2.9%
Immigrants | Sweden
100.0
/100
|
#13
Exceptional
2.9%
Immigrants | France
100.0
/100
|
#14
Exceptional
2.9%
Immigrants | India
100.0
/100
|
#15
Exceptional
2.8%

Demographics Similar to Indonesians by Doctorate Degree

In terms of doctorate degree, the demographic groups most similar to Indonesians are Iroquois (1.6%, a difference of 0.19%), Cree (1.6%, a difference of 0.29%), Immigrants from Congo (1.6%, a difference of 0.39%), Hopi (1.6%, a difference of 0.50%), and West Indian (1.6%, a difference of 0.50%).
DemographicsRating | RankDoctorate Degree
Colville
4.7
/100
|
#229
Tragic
1.6%
Immigrants | Philippines
4.3
/100
|
#230
Tragic
1.6%
Immigrants | North Macedonia
3.9
/100
|
#231
Tragic
1.6%
Guamanians/Chamorros
3.3
/100
|
#232
Tragic
1.6%
Barbadians
3.3
/100
|
#233
Tragic
1.6%
Hopi
3.2
/100
|
#234
Tragic
1.6%
Cree
3.0
/100
|
#235
Tragic
1.6%
Indonesians
2.8
/100
|
#236
Tragic
1.6%
Iroquois
2.7
/100
|
#237
Tragic
1.6%
Immigrants | Congo
2.6
/100
|
#238
Tragic
1.6%
West Indians
2.5
/100
|
#239
Tragic
1.6%
Immigrants | Panama
2.4
/100
|
#240
Tragic
1.6%
Cheyenne
2.3
/100
|
#241
Tragic
1.6%
Ottawa
2.2
/100
|
#242
Tragic
1.6%
Native Hawaiians
2.1
/100
|
#243
Tragic
1.6%