Trinidadian and Tobagonian vs Icelander Doctorate Degree
COMPARE
Trinidadian and Tobagonian
Icelander
Doctorate Degree
Doctorate Degree Comparison
Trinidadians and Tobagonians
Icelanders
1.5%
DOCTORATE DEGREE
1.0/ 100
METRIC RATING
255th/ 347
METRIC RANK
2.1%
DOCTORATE DEGREE
96.0/ 100
METRIC RATING
118th/ 347
METRIC RANK
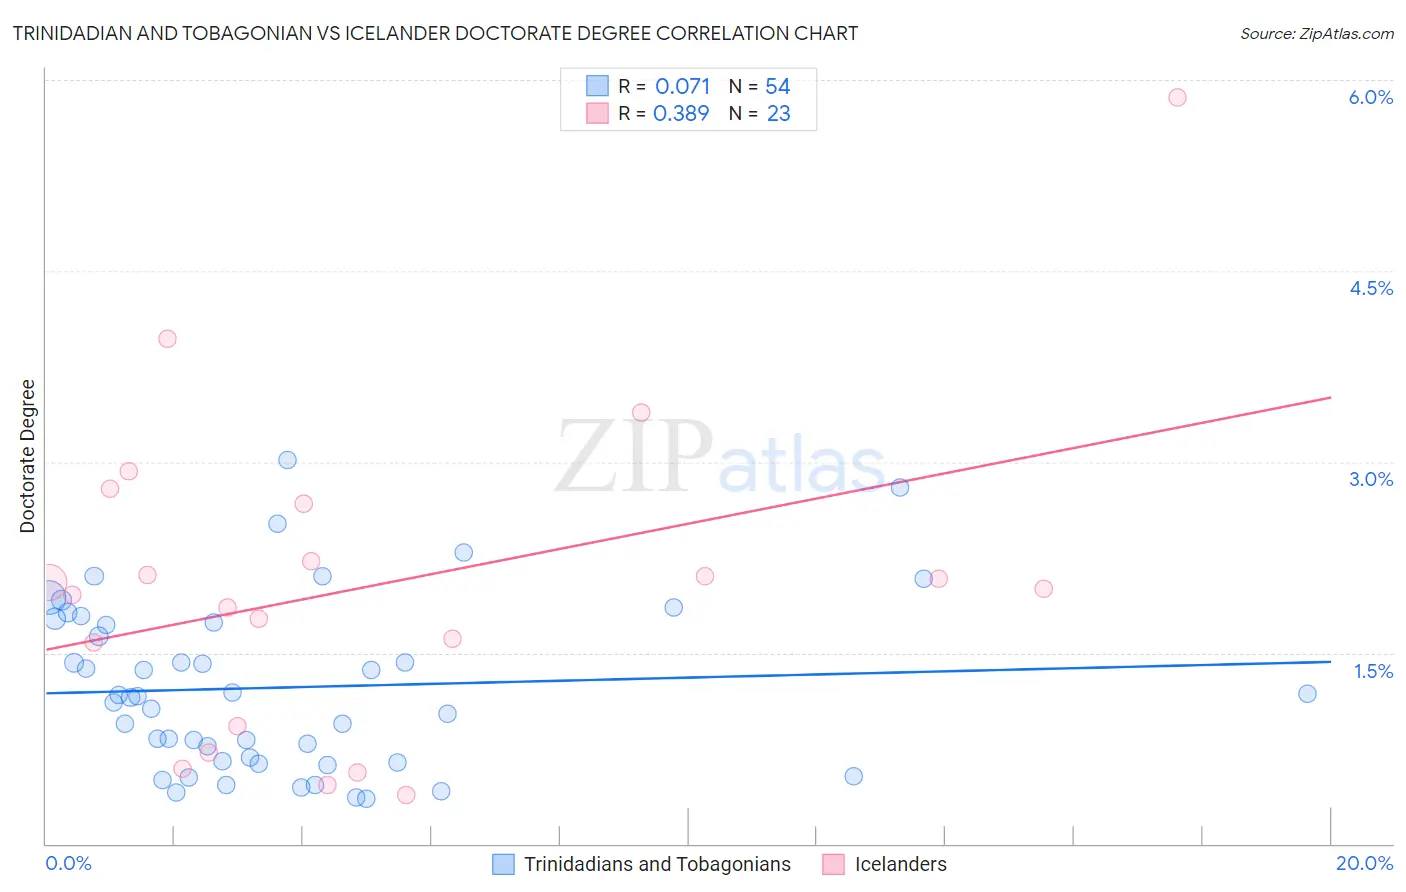
Trinidadian and Tobagonian vs Icelander Doctorate Degree Correlation Chart
The statistical analysis conducted on geographies consisting of 218,914,311 people shows a slight positive correlation between the proportion of Trinidadians and Tobagonians and percentage of population with at least doctorate degree education in the United States with a correlation coefficient (R) of 0.071 and weighted average of 1.5%. Similarly, the statistical analysis conducted on geographies consisting of 159,042,480 people shows a mild positive correlation between the proportion of Icelanders and percentage of population with at least doctorate degree education in the United States with a correlation coefficient (R) of 0.389 and weighted average of 2.1%, a difference of 34.3%.
Doctorate Degree Correlation Summary
| Measurement | Trinidadian and Tobagonian | Icelander |
| Minimum | 0.35% | 0.38% |
| Maximum | 3.0% | 5.9% |
| Range | 2.7% | 5.5% |
| Mean | 1.2% | 2.0% |
| Median | 1.2% | 2.0% |
| Interquartile 25% (IQ1) | 0.65% | 0.93% |
| Interquartile 75% (IQ3) | 1.7% | 2.7% |
| Interquartile Range (IQR) | 1.1% | 1.7% |
| Standard Deviation (Sample) | 0.66% | 1.3% |
| Standard Deviation (Population) | 0.65% | 1.2% |
Similar Demographics by Doctorate Degree
Demographics Similar to Trinidadians and Tobagonians by Doctorate Degree
In terms of doctorate degree, the demographic groups most similar to Trinidadians and Tobagonians are Immigrants from Cambodia (1.5%, a difference of 0.010%), Central American Indian (1.5%, a difference of 0.050%), American (1.5%, a difference of 0.13%), Chippewa (1.5%, a difference of 0.27%), and Yuman (1.5%, a difference of 0.28%).
| Demographics | Rating | Rank | Doctorate Degree |
| Africans | 1.8 /100 | #248 | Tragic 1.6% |
| Potawatomi | 1.6 /100 | #249 | Tragic 1.6% |
| Immigrants | Fiji | 1.6 /100 | #250 | Tragic 1.6% |
| Apache | 1.3 /100 | #251 | Tragic 1.5% |
| Yuman | 1.1 /100 | #252 | Tragic 1.5% |
| Americans | 1.0 /100 | #253 | Tragic 1.5% |
| Immigrants | Cambodia | 1.0 /100 | #254 | Tragic 1.5% |
| Trinidadians and Tobagonians | 1.0 /100 | #255 | Tragic 1.5% |
| Central American Indians | 1.0 /100 | #256 | Tragic 1.5% |
| Chippewa | 0.9 /100 | #257 | Tragic 1.5% |
| Immigrants | West Indies | 0.9 /100 | #258 | Tragic 1.5% |
| Liberians | 0.9 /100 | #259 | Tragic 1.5% |
| Japanese | 0.9 /100 | #260 | Tragic 1.5% |
| Immigrants | Portugal | 0.8 /100 | #261 | Tragic 1.5% |
| Chickasaw | 0.7 /100 | #262 | Tragic 1.5% |
Demographics Similar to Icelanders by Doctorate Degree
In terms of doctorate degree, the demographic groups most similar to Icelanders are Lebanese (2.1%, a difference of 0.040%), Pakistani (2.0%, a difference of 0.13%), Maltese (2.1%, a difference of 0.21%), Immigrants from Morocco (2.0%, a difference of 0.42%), and Taiwanese (2.1%, a difference of 0.67%).
| Demographics | Rating | Rank | Doctorate Degree |
| Immigrants | Pakistan | 97.1 /100 | #111 | Exceptional 2.1% |
| Syrians | 97.1 /100 | #112 | Exceptional 2.1% |
| Immigrants | Italy | 96.9 /100 | #113 | Exceptional 2.1% |
| Immigrants | Croatia | 96.8 /100 | #114 | Exceptional 2.1% |
| Taiwanese | 96.7 /100 | #115 | Exceptional 2.1% |
| Maltese | 96.2 /100 | #116 | Exceptional 2.1% |
| Lebanese | 96.0 /100 | #117 | Exceptional 2.1% |
| Icelanders | 96.0 /100 | #118 | Exceptional 2.1% |
| Pakistanis | 95.8 /100 | #119 | Exceptional 2.0% |
| Immigrants | Morocco | 95.5 /100 | #120 | Exceptional 2.0% |
| Immigrants | Jordan | 94.8 /100 | #121 | Exceptional 2.0% |
| Immigrants | Southern Europe | 94.7 /100 | #122 | Exceptional 2.0% |
| Croatians | 94.0 /100 | #123 | Exceptional 2.0% |
| Ute | 93.2 /100 | #124 | Exceptional 2.0% |
| Moroccans | 93.0 /100 | #125 | Exceptional 2.0% |