Serbian vs Indonesian Doctorate Degree
COMPARE
Serbian
Indonesian
Doctorate Degree
Doctorate Degree Comparison
Serbians
Indonesians
2.0%
DOCTORATE DEGREE
88.7/ 100
METRIC RATING
135th/ 347
METRIC RANK
1.6%
DOCTORATE DEGREE
2.8/ 100
METRIC RATING
236th/ 347
METRIC RANK
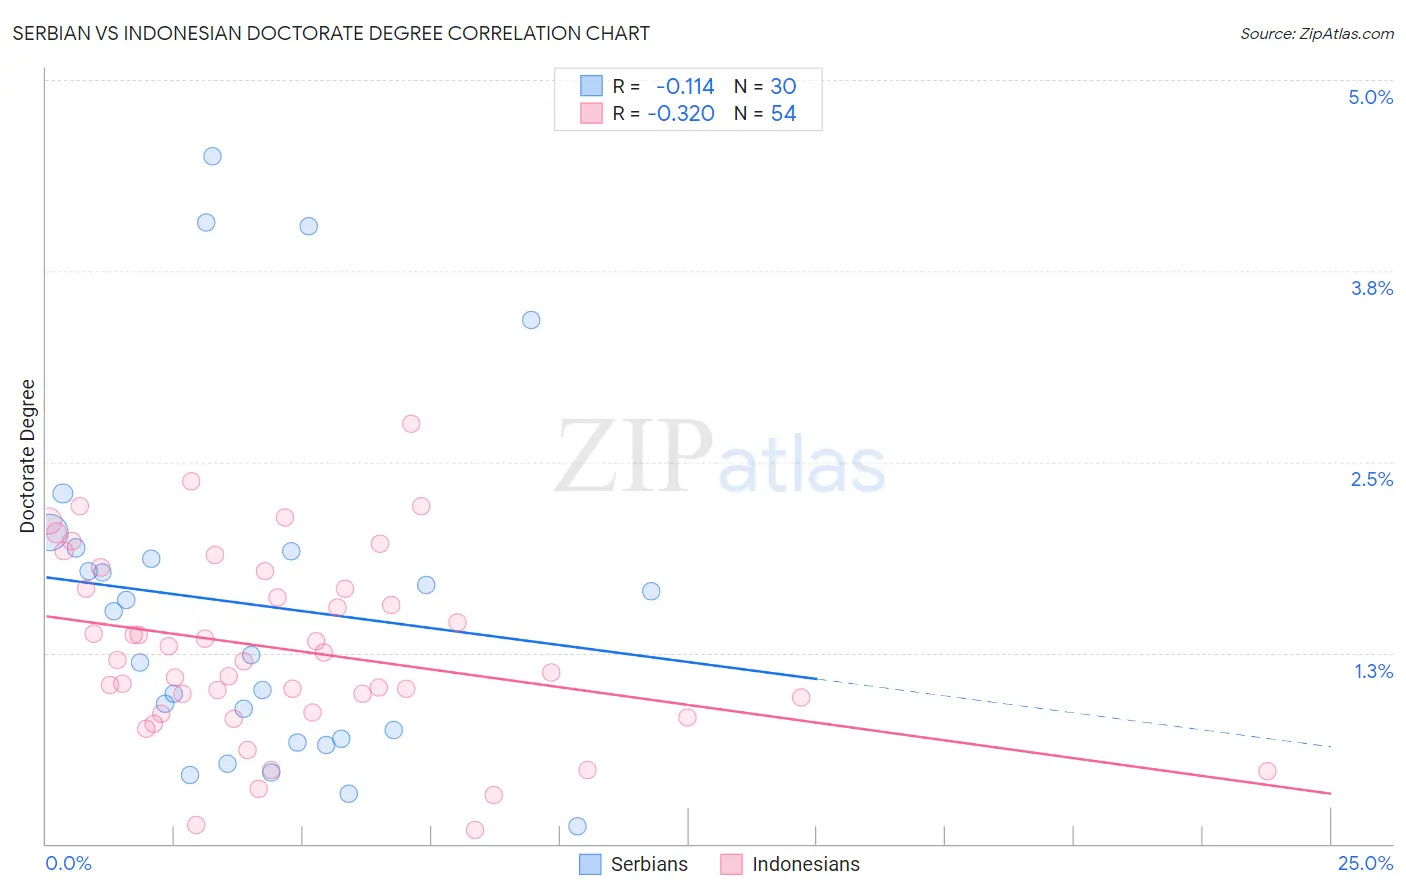
Serbian vs Indonesian Doctorate Degree Correlation Chart
The statistical analysis conducted on geographies consisting of 265,941,382 people shows a poor negative correlation between the proportion of Serbians and percentage of population with at least doctorate degree education in the United States with a correlation coefficient (R) of -0.114 and weighted average of 2.0%. Similarly, the statistical analysis conducted on geographies consisting of 162,227,737 people shows a mild negative correlation between the proportion of Indonesians and percentage of population with at least doctorate degree education in the United States with a correlation coefficient (R) of -0.320 and weighted average of 1.6%, a difference of 23.6%.
Doctorate Degree Correlation Summary
| Measurement | Serbian | Indonesian |
| Minimum | 0.11% | 0.089% |
| Maximum | 4.5% | 2.7% |
| Range | 4.4% | 2.7% |
| Mean | 1.6% | 1.3% |
| Median | 1.4% | 1.2% |
| Interquartile 25% (IQ1) | 0.69% | 0.86% |
| Interquartile 75% (IQ3) | 1.9% | 1.7% |
| Interquartile Range (IQR) | 1.2% | 0.81% |
| Standard Deviation (Sample) | 1.1% | 0.60% |
| Standard Deviation (Population) | 1.1% | 0.59% |
Similar Demographics by Doctorate Degree
Demographics Similar to Serbians by Doctorate Degree
In terms of doctorate degree, the demographic groups most similar to Serbians are Immigrants from Cameroon (2.0%, a difference of 0.060%), Swedish (2.0%, a difference of 0.14%), South American Indian (2.0%, a difference of 0.15%), Immigrants from Uzbekistan (2.0%, a difference of 0.21%), and Swiss (2.0%, a difference of 0.24%).
| Demographics | Rating | Rank | Doctorate Degree |
| Immigrants | Zaire | 91.1 /100 | #128 | Exceptional 2.0% |
| Canadians | 90.6 /100 | #129 | Exceptional 2.0% |
| Immigrants | Ukraine | 90.5 /100 | #130 | Exceptional 2.0% |
| Immigrants | Sierra Leone | 90.2 /100 | #131 | Exceptional 2.0% |
| Scottish | 89.4 /100 | #132 | Excellent 2.0% |
| Immigrants | Uzbekistan | 89.3 /100 | #133 | Excellent 2.0% |
| Immigrants | Cameroon | 88.9 /100 | #134 | Excellent 2.0% |
| Serbians | 88.7 /100 | #135 | Excellent 2.0% |
| Swedes | 88.3 /100 | #136 | Excellent 2.0% |
| South American Indians | 88.3 /100 | #137 | Excellent 2.0% |
| Swiss | 88.0 /100 | #138 | Excellent 2.0% |
| Afghans | 87.2 /100 | #139 | Excellent 2.0% |
| Immigrants | Africa | 87.0 /100 | #140 | Excellent 2.0% |
| Senegalese | 86.7 /100 | #141 | Excellent 2.0% |
| Italians | 86.0 /100 | #142 | Excellent 2.0% |
Demographics Similar to Indonesians by Doctorate Degree
In terms of doctorate degree, the demographic groups most similar to Indonesians are Iroquois (1.6%, a difference of 0.19%), Cree (1.6%, a difference of 0.29%), Immigrants from Congo (1.6%, a difference of 0.39%), Hopi (1.6%, a difference of 0.50%), and West Indian (1.6%, a difference of 0.50%).
| Demographics | Rating | Rank | Doctorate Degree |
| Colville | 4.7 /100 | #229 | Tragic 1.6% |
| Immigrants | Philippines | 4.3 /100 | #230 | Tragic 1.6% |
| Immigrants | North Macedonia | 3.9 /100 | #231 | Tragic 1.6% |
| Guamanians/Chamorros | 3.3 /100 | #232 | Tragic 1.6% |
| Barbadians | 3.3 /100 | #233 | Tragic 1.6% |
| Hopi | 3.2 /100 | #234 | Tragic 1.6% |
| Cree | 3.0 /100 | #235 | Tragic 1.6% |
| Indonesians | 2.8 /100 | #236 | Tragic 1.6% |
| Iroquois | 2.7 /100 | #237 | Tragic 1.6% |
| Immigrants | Congo | 2.6 /100 | #238 | Tragic 1.6% |
| West Indians | 2.5 /100 | #239 | Tragic 1.6% |
| Immigrants | Panama | 2.4 /100 | #240 | Tragic 1.6% |
| Cheyenne | 2.3 /100 | #241 | Tragic 1.6% |
| Ottawa | 2.2 /100 | #242 | Tragic 1.6% |
| Native Hawaiians | 2.1 /100 | #243 | Tragic 1.6% |