Tongan vs Immigrants from Iran Master's Degree
COMPARE
Tongan
Immigrants from Iran
Master's Degree
Master's Degree Comparison
Tongans
Immigrants from Iran
12.5%
MASTER'S DEGREE
0.6/ 100
METRIC RATING
261st/ 347
METRIC RANK
21.6%
MASTER'S DEGREE
100.0/ 100
METRIC RATING
10th/ 347
METRIC RANK
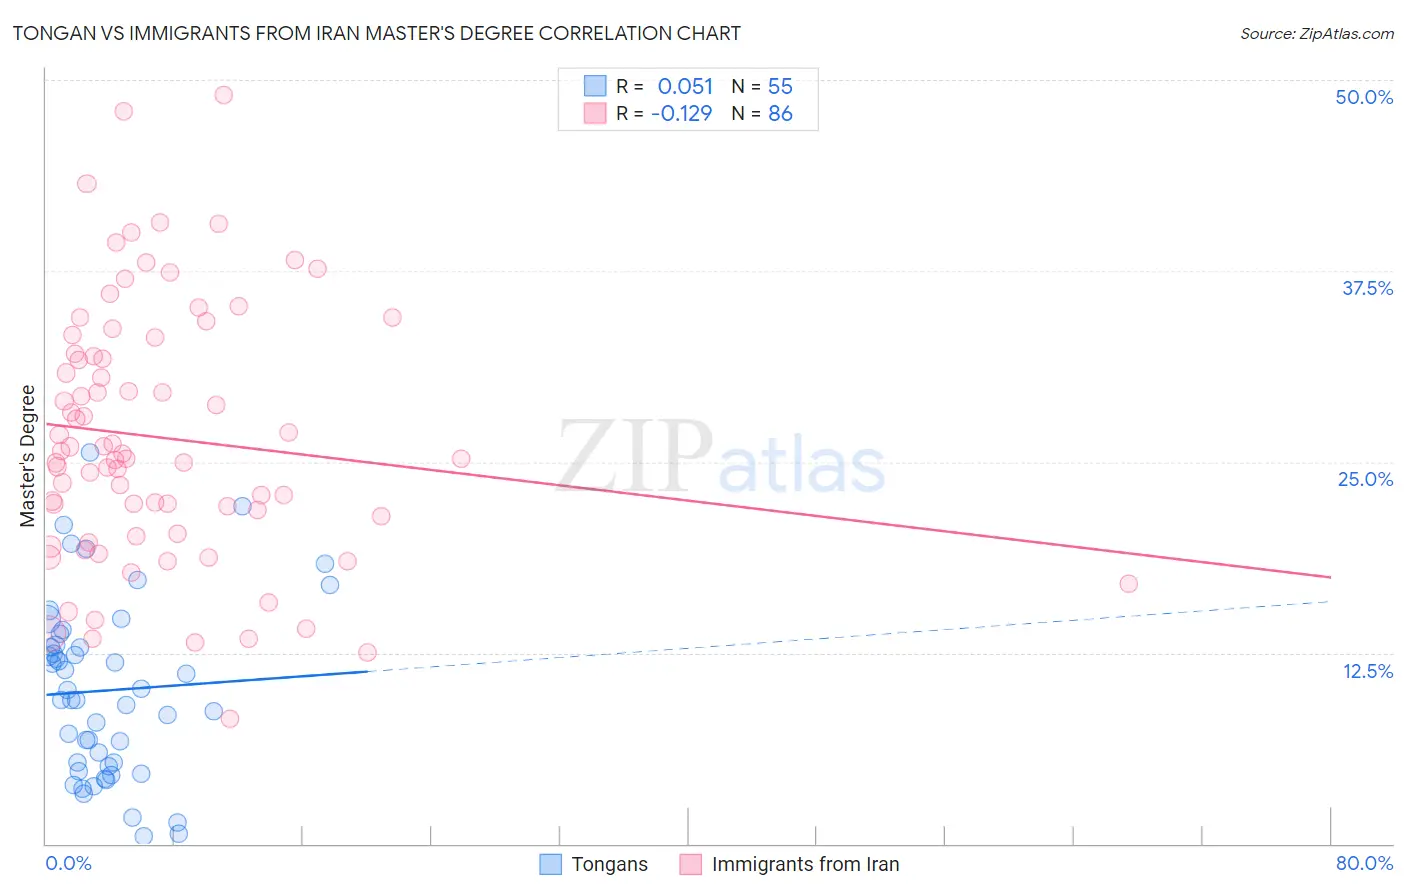
Tongan vs Immigrants from Iran Master's Degree Correlation Chart
The statistical analysis conducted on geographies consisting of 102,792,797 people shows a slight positive correlation between the proportion of Tongans and percentage of population with at least master's degree education in the United States with a correlation coefficient (R) of 0.051 and weighted average of 12.5%. Similarly, the statistical analysis conducted on geographies consisting of 279,879,707 people shows a poor negative correlation between the proportion of Immigrants from Iran and percentage of population with at least master's degree education in the United States with a correlation coefficient (R) of -0.129 and weighted average of 21.6%, a difference of 73.2%.
Master's Degree Correlation Summary
| Measurement | Tongan | Immigrants from Iran |
| Minimum | 0.46% | 8.2% |
| Maximum | 25.6% | 49.0% |
| Range | 25.2% | 40.8% |
| Mean | 10.0% | 26.6% |
| Median | 9.5% | 25.4% |
| Interquartile 25% (IQ1) | 5.1% | 20.3% |
| Interquartile 75% (IQ3) | 13.0% | 32.1% |
| Interquartile Range (IQR) | 7.9% | 11.8% |
| Standard Deviation (Sample) | 5.8% | 8.4% |
| Standard Deviation (Population) | 5.7% | 8.4% |
Similar Demographics by Master's Degree
Demographics Similar to Tongans by Master's Degree
In terms of master's degree, the demographic groups most similar to Tongans are Japanese (12.5%, a difference of 0.040%), Dominican (12.5%, a difference of 0.040%), Immigrants from Liberia (12.5%, a difference of 0.13%), Nicaraguan (12.5%, a difference of 0.18%), and Central American Indian (12.4%, a difference of 0.42%).
| Demographics | Rating | Rank | Master's Degree |
| Indonesians | 0.8 /100 | #254 | Tragic 12.6% |
| Immigrants | Congo | 0.8 /100 | #255 | Tragic 12.6% |
| Immigrants | Portugal | 0.8 /100 | #256 | Tragic 12.6% |
| Osage | 0.7 /100 | #257 | Tragic 12.6% |
| Immigrants | Liberia | 0.6 /100 | #258 | Tragic 12.5% |
| Japanese | 0.6 /100 | #259 | Tragic 12.5% |
| Dominicans | 0.6 /100 | #260 | Tragic 12.5% |
| Tongans | 0.6 /100 | #261 | Tragic 12.5% |
| Nicaraguans | 0.6 /100 | #262 | Tragic 12.5% |
| Central American Indians | 0.5 /100 | #263 | Tragic 12.4% |
| Belizeans | 0.5 /100 | #264 | Tragic 12.4% |
| Immigrants | Fiji | 0.5 /100 | #265 | Tragic 12.4% |
| Bahamians | 0.5 /100 | #266 | Tragic 12.4% |
| Americans | 0.4 /100 | #267 | Tragic 12.3% |
| Native Hawaiians | 0.4 /100 | #268 | Tragic 12.3% |
Demographics Similar to Immigrants from Iran by Master's Degree
In terms of master's degree, the demographic groups most similar to Immigrants from Iran are Thai (21.7%, a difference of 0.41%), Cypriot (21.8%, a difference of 0.75%), Immigrants from China (21.2%, a difference of 2.1%), Eastern European (21.1%, a difference of 2.4%), and Iranian (22.3%, a difference of 3.0%).
| Demographics | Rating | Rank | Master's Degree |
| Immigrants | Israel | 100.0 /100 | #3 | Exceptional 22.6% |
| Okinawans | 100.0 /100 | #4 | Exceptional 22.6% |
| Immigrants | Taiwan | 100.0 /100 | #5 | Exceptional 22.5% |
| Immigrants | India | 100.0 /100 | #6 | Exceptional 22.3% |
| Iranians | 100.0 /100 | #7 | Exceptional 22.3% |
| Cypriots | 100.0 /100 | #8 | Exceptional 21.8% |
| Thais | 100.0 /100 | #9 | Exceptional 21.7% |
| Immigrants | Iran | 100.0 /100 | #10 | Exceptional 21.6% |
| Immigrants | China | 100.0 /100 | #11 | Exceptional 21.2% |
| Eastern Europeans | 100.0 /100 | #12 | Exceptional 21.1% |
| Immigrants | Australia | 100.0 /100 | #13 | Exceptional 20.9% |
| Immigrants | Switzerland | 100.0 /100 | #14 | Exceptional 20.9% |
| Immigrants | Eastern Asia | 100.0 /100 | #15 | Exceptional 20.8% |
| Immigrants | Belgium | 100.0 /100 | #16 | Exceptional 20.8% |
| Immigrants | South Central Asia | 100.0 /100 | #17 | Exceptional 20.7% |