Tongan vs Arab Master's Degree
COMPARE
Tongan
Arab
Master's Degree
Master's Degree Comparison
Tongans
Arabs
12.5%
MASTER'S DEGREE
0.6/ 100
METRIC RATING
261st/ 347
METRIC RANK
16.7%
MASTER'S DEGREE
97.7/ 100
METRIC RATING
113th/ 347
METRIC RANK
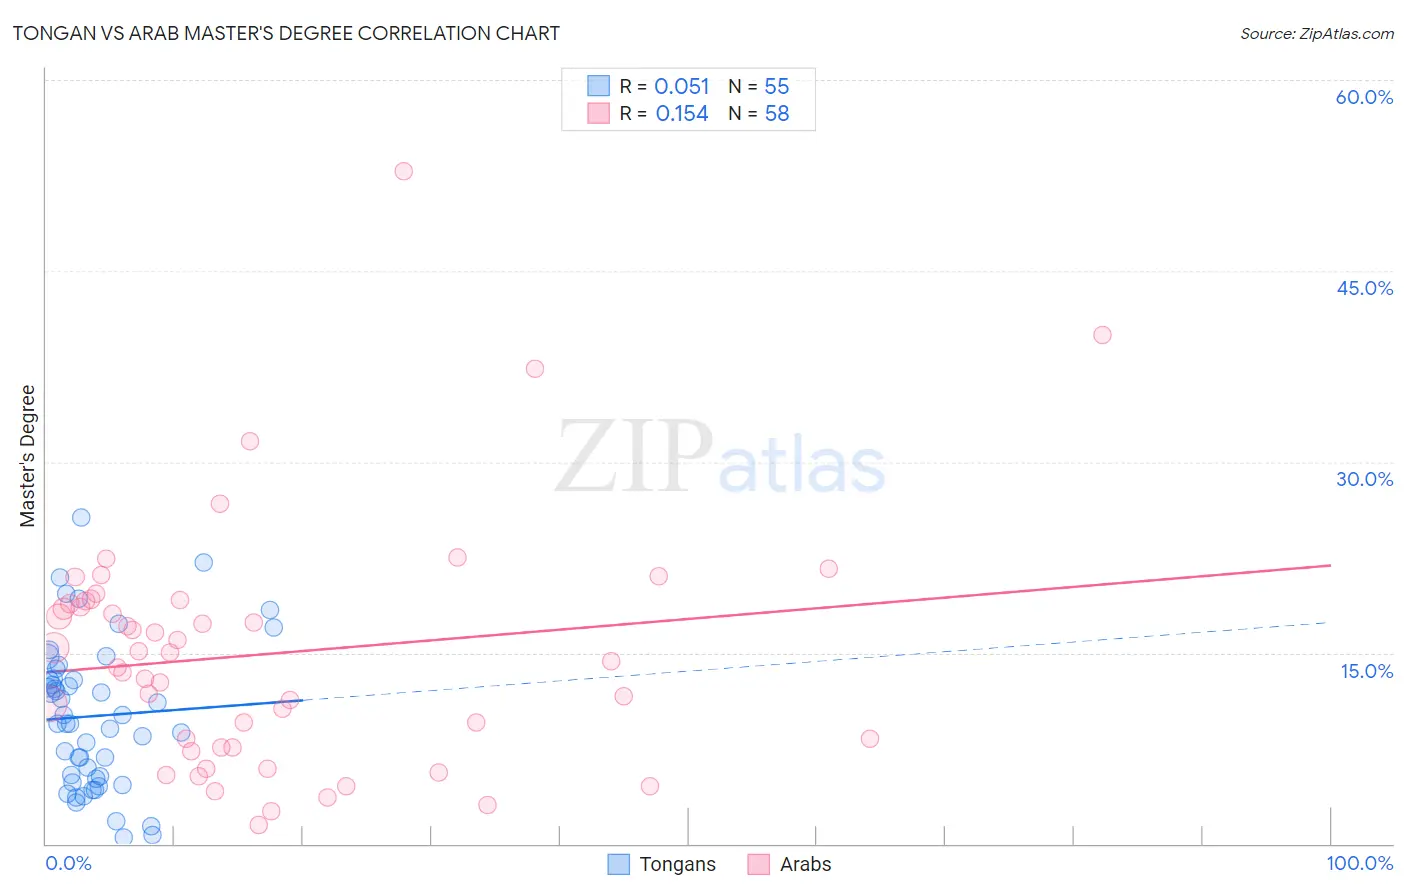
Tongan vs Arab Master's Degree Correlation Chart
The statistical analysis conducted on geographies consisting of 102,792,797 people shows a slight positive correlation between the proportion of Tongans and percentage of population with at least master's degree education in the United States with a correlation coefficient (R) of 0.051 and weighted average of 12.5%. Similarly, the statistical analysis conducted on geographies consisting of 486,607,303 people shows a poor positive correlation between the proportion of Arabs and percentage of population with at least master's degree education in the United States with a correlation coefficient (R) of 0.154 and weighted average of 16.7%, a difference of 33.7%.
Master's Degree Correlation Summary
| Measurement | Tongan | Arab |
| Minimum | 0.46% | 1.5% |
| Maximum | 25.6% | 52.8% |
| Range | 25.2% | 51.4% |
| Mean | 10.0% | 14.9% |
| Median | 9.5% | 14.7% |
| Interquartile 25% (IQ1) | 5.1% | 7.6% |
| Interquartile 75% (IQ3) | 13.0% | 19.1% |
| Interquartile Range (IQR) | 7.9% | 11.5% |
| Standard Deviation (Sample) | 5.8% | 9.5% |
| Standard Deviation (Population) | 5.7% | 9.5% |
Similar Demographics by Master's Degree
Demographics Similar to Tongans by Master's Degree
In terms of master's degree, the demographic groups most similar to Tongans are Japanese (12.5%, a difference of 0.040%), Dominican (12.5%, a difference of 0.040%), Immigrants from Liberia (12.5%, a difference of 0.13%), Nicaraguan (12.5%, a difference of 0.18%), and Central American Indian (12.4%, a difference of 0.42%).
| Demographics | Rating | Rank | Master's Degree |
| Indonesians | 0.8 /100 | #254 | Tragic 12.6% |
| Immigrants | Congo | 0.8 /100 | #255 | Tragic 12.6% |
| Immigrants | Portugal | 0.8 /100 | #256 | Tragic 12.6% |
| Osage | 0.7 /100 | #257 | Tragic 12.6% |
| Immigrants | Liberia | 0.6 /100 | #258 | Tragic 12.5% |
| Japanese | 0.6 /100 | #259 | Tragic 12.5% |
| Dominicans | 0.6 /100 | #260 | Tragic 12.5% |
| Tongans | 0.6 /100 | #261 | Tragic 12.5% |
| Nicaraguans | 0.6 /100 | #262 | Tragic 12.5% |
| Central American Indians | 0.5 /100 | #263 | Tragic 12.4% |
| Belizeans | 0.5 /100 | #264 | Tragic 12.4% |
| Immigrants | Fiji | 0.5 /100 | #265 | Tragic 12.4% |
| Bahamians | 0.5 /100 | #266 | Tragic 12.4% |
| Americans | 0.4 /100 | #267 | Tragic 12.3% |
| Native Hawaiians | 0.4 /100 | #268 | Tragic 12.3% |
Demographics Similar to Arabs by Master's Degree
In terms of master's degree, the demographic groups most similar to Arabs are Macedonian (16.7%, a difference of 0.010%), Northern European (16.7%, a difference of 0.070%), Austrian (16.7%, a difference of 0.15%), Immigrants from Uganda (16.6%, a difference of 0.37%), and Immigrants from Chile (16.8%, a difference of 0.42%).
| Demographics | Rating | Rank | Master's Degree |
| Immigrants | Albania | 98.1 /100 | #106 | Exceptional 16.8% |
| Armenians | 98.0 /100 | #107 | Exceptional 16.8% |
| Sierra Leoneans | 98.0 /100 | #108 | Exceptional 16.8% |
| Moroccans | 98.0 /100 | #109 | Exceptional 16.8% |
| Immigrants | Chile | 98.0 /100 | #110 | Exceptional 16.8% |
| Austrians | 97.8 /100 | #111 | Exceptional 16.7% |
| Macedonians | 97.7 /100 | #112 | Exceptional 16.7% |
| Arabs | 97.7 /100 | #113 | Exceptional 16.7% |
| Northern Europeans | 97.6 /100 | #114 | Exceptional 16.7% |
| Immigrants | Uganda | 97.3 /100 | #115 | Exceptional 16.6% |
| Immigrants | Southern Europe | 97.2 /100 | #116 | Exceptional 16.6% |
| Immigrants | Moldova | 97.2 /100 | #117 | Exceptional 16.6% |
| Brazilians | 96.8 /100 | #118 | Exceptional 16.5% |
| Jordanians | 96.5 /100 | #119 | Exceptional 16.5% |
| Lebanese | 96.4 /100 | #120 | Exceptional 16.5% |