Tongan vs Immigrants from Burma/Myanmar Master's Degree
COMPARE
Tongan
Immigrants from Burma/Myanmar
Master's Degree
Master's Degree Comparison
Tongans
Immigrants from Burma/Myanmar
12.5%
MASTER'S DEGREE
0.6/ 100
METRIC RATING
261st/ 347
METRIC RANK
13.5%
MASTER'S DEGREE
5.0/ 100
METRIC RATING
234th/ 347
METRIC RANK
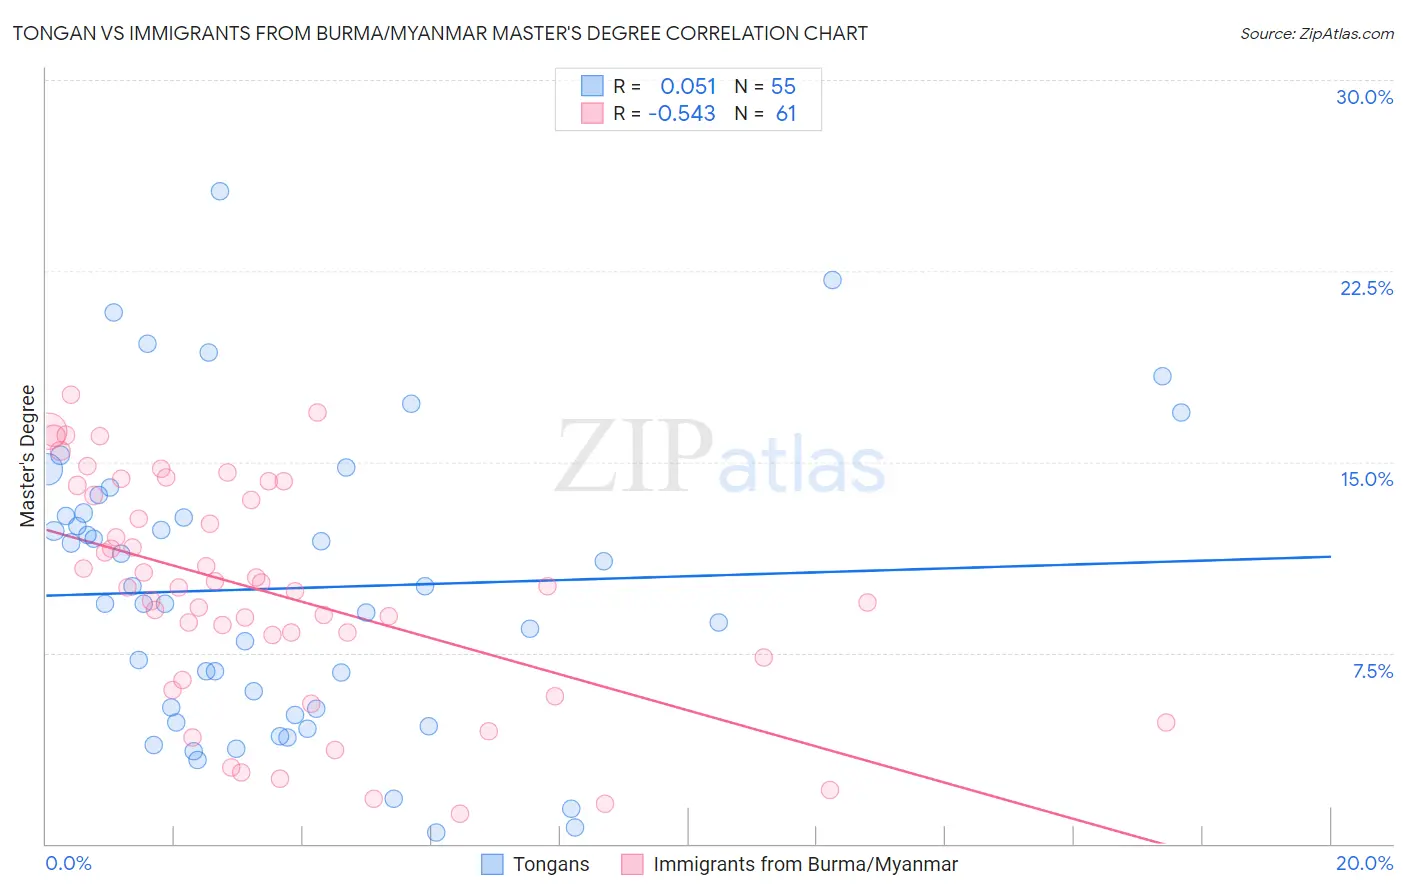
Tongan vs Immigrants from Burma/Myanmar Master's Degree Correlation Chart
The statistical analysis conducted on geographies consisting of 102,792,797 people shows a slight positive correlation between the proportion of Tongans and percentage of population with at least master's degree education in the United States with a correlation coefficient (R) of 0.051 and weighted average of 12.5%. Similarly, the statistical analysis conducted on geographies consisting of 172,302,674 people shows a substantial negative correlation between the proportion of Immigrants from Burma/Myanmar and percentage of population with at least master's degree education in the United States with a correlation coefficient (R) of -0.543 and weighted average of 13.5%, a difference of 8.2%.
Master's Degree Correlation Summary
| Measurement | Tongan | Immigrants from Burma/Myanmar |
| Minimum | 0.46% | 1.2% |
| Maximum | 25.6% | 17.6% |
| Range | 25.2% | 16.5% |
| Mean | 10.0% | 9.9% |
| Median | 9.5% | 10.1% |
| Interquartile 25% (IQ1) | 5.1% | 6.9% |
| Interquartile 75% (IQ3) | 13.0% | 13.9% |
| Interquartile Range (IQR) | 7.9% | 7.0% |
| Standard Deviation (Sample) | 5.8% | 4.4% |
| Standard Deviation (Population) | 5.7% | 4.3% |
Similar Demographics by Master's Degree
Demographics Similar to Tongans by Master's Degree
In terms of master's degree, the demographic groups most similar to Tongans are Japanese (12.5%, a difference of 0.040%), Dominican (12.5%, a difference of 0.040%), Immigrants from Liberia (12.5%, a difference of 0.13%), Nicaraguan (12.5%, a difference of 0.18%), and Central American Indian (12.4%, a difference of 0.42%).
| Demographics | Rating | Rank | Master's Degree |
| Indonesians | 0.8 /100 | #254 | Tragic 12.6% |
| Immigrants | Congo | 0.8 /100 | #255 | Tragic 12.6% |
| Immigrants | Portugal | 0.8 /100 | #256 | Tragic 12.6% |
| Osage | 0.7 /100 | #257 | Tragic 12.6% |
| Immigrants | Liberia | 0.6 /100 | #258 | Tragic 12.5% |
| Japanese | 0.6 /100 | #259 | Tragic 12.5% |
| Dominicans | 0.6 /100 | #260 | Tragic 12.5% |
| Tongans | 0.6 /100 | #261 | Tragic 12.5% |
| Nicaraguans | 0.6 /100 | #262 | Tragic 12.5% |
| Central American Indians | 0.5 /100 | #263 | Tragic 12.4% |
| Belizeans | 0.5 /100 | #264 | Tragic 12.4% |
| Immigrants | Fiji | 0.5 /100 | #265 | Tragic 12.4% |
| Bahamians | 0.5 /100 | #266 | Tragic 12.4% |
| Americans | 0.4 /100 | #267 | Tragic 12.3% |
| Native Hawaiians | 0.4 /100 | #268 | Tragic 12.3% |
Demographics Similar to Immigrants from Burma/Myanmar by Master's Degree
In terms of master's degree, the demographic groups most similar to Immigrants from Burma/Myanmar are German Russian (13.5%, a difference of 0.41%), Immigrants from Ecuador (13.6%, a difference of 0.50%), Immigrants from Guyana (13.4%, a difference of 0.52%), Immigrants from Philippines (13.6%, a difference of 0.65%), and Jamaican (13.4%, a difference of 0.75%).
| Demographics | Rating | Rank | Master's Degree |
| Immigrants | West Indies | 9.8 /100 | #227 | Tragic 13.9% |
| Whites/Caucasians | 9.1 /100 | #228 | Tragic 13.8% |
| British West Indians | 8.8 /100 | #229 | Tragic 13.8% |
| Dutch | 8.7 /100 | #230 | Tragic 13.8% |
| Guyanese | 7.6 /100 | #231 | Tragic 13.7% |
| Immigrants | Philippines | 6.0 /100 | #232 | Tragic 13.6% |
| Immigrants | Ecuador | 5.7 /100 | #233 | Tragic 13.6% |
| Immigrants | Burma/Myanmar | 5.0 /100 | #234 | Tragic 13.5% |
| German Russians | 4.5 /100 | #235 | Tragic 13.5% |
| Immigrants | Guyana | 4.4 /100 | #236 | Tragic 13.4% |
| Jamaicans | 4.1 /100 | #237 | Tragic 13.4% |
| Hmong | 4.0 /100 | #238 | Tragic 13.4% |
| Immigrants | Nonimmigrants | 3.4 /100 | #239 | Tragic 13.3% |
| Guamanians/Chamorros | 2.2 /100 | #240 | Tragic 13.1% |
| U.S. Virgin Islanders | 2.1 /100 | #241 | Tragic 13.1% |