Hispanic or Latino vs Immigrants from Iran Master's Degree
COMPARE
Hispanic or Latino
Immigrants from Iran
Master's Degree
Master's Degree Comparison
Hispanics or Latinos
Immigrants from Iran
10.9%
MASTER'S DEGREE
0.0/ 100
METRIC RATING
316th/ 347
METRIC RANK
21.6%
MASTER'S DEGREE
100.0/ 100
METRIC RATING
10th/ 347
METRIC RANK
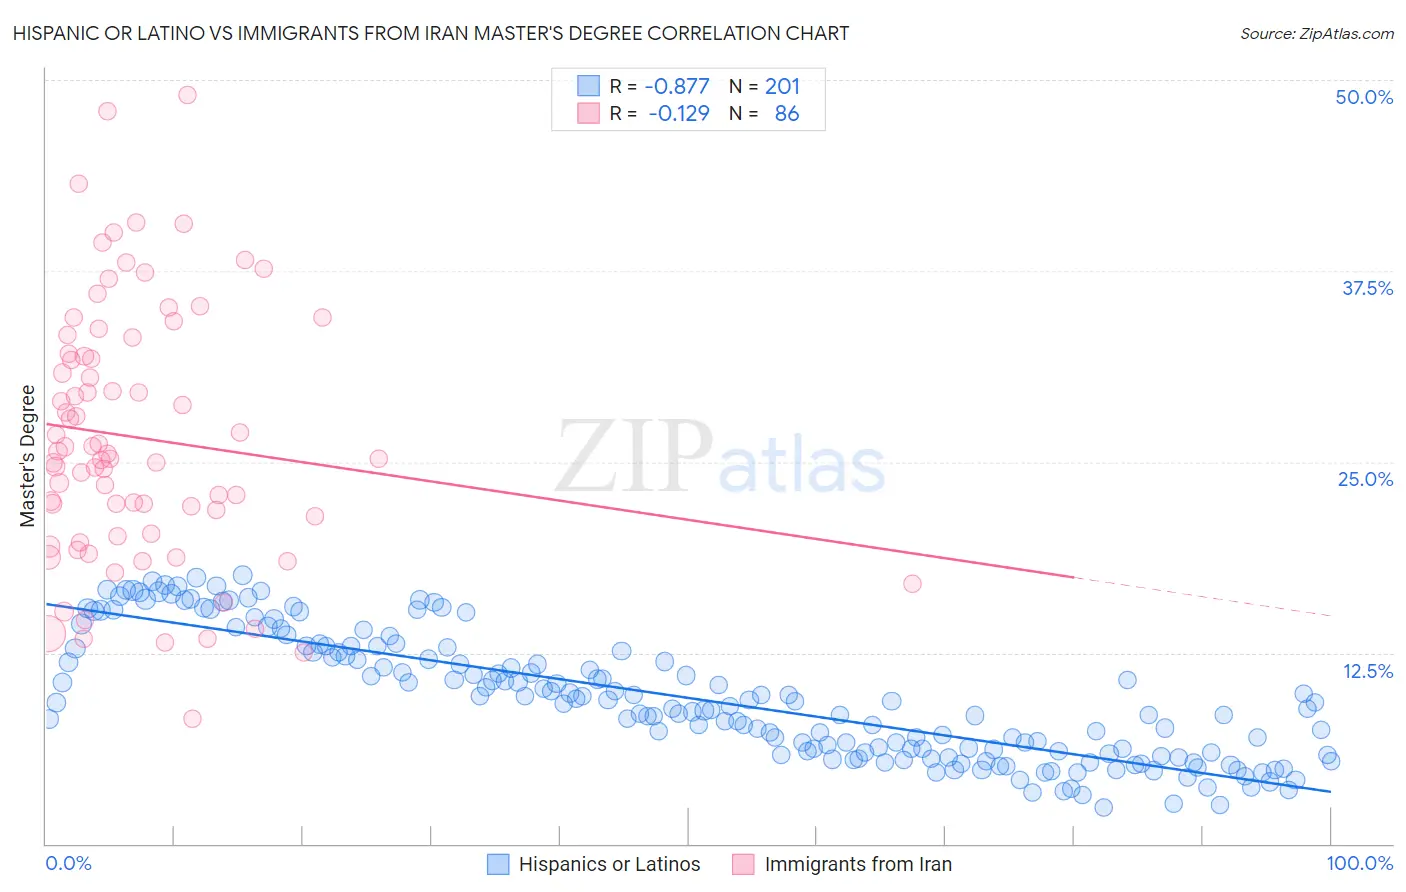
Hispanic or Latino vs Immigrants from Iran Master's Degree Correlation Chart
The statistical analysis conducted on geographies consisting of 577,228,232 people shows a very strong negative correlation between the proportion of Hispanics or Latinos and percentage of population with at least master's degree education in the United States with a correlation coefficient (R) of -0.877 and weighted average of 10.9%. Similarly, the statistical analysis conducted on geographies consisting of 279,879,707 people shows a poor negative correlation between the proportion of Immigrants from Iran and percentage of population with at least master's degree education in the United States with a correlation coefficient (R) of -0.129 and weighted average of 21.6%, a difference of 97.9%.
Master's Degree Correlation Summary
| Measurement | Hispanic or Latino | Immigrants from Iran |
| Minimum | 2.4% | 8.2% |
| Maximum | 17.6% | 49.0% |
| Range | 15.2% | 40.8% |
| Mean | 9.5% | 26.6% |
| Median | 9.2% | 25.4% |
| Interquartile 25% (IQ1) | 5.9% | 20.3% |
| Interquartile 75% (IQ3) | 12.7% | 32.1% |
| Interquartile Range (IQR) | 6.8% | 11.8% |
| Standard Deviation (Sample) | 4.1% | 8.4% |
| Standard Deviation (Population) | 4.1% | 8.4% |
Similar Demographics by Master's Degree
Demographics Similar to Hispanics or Latinos by Master's Degree
In terms of master's degree, the demographic groups most similar to Hispanics or Latinos are Apache (11.0%, a difference of 0.34%), Cajun (11.0%, a difference of 0.35%), Hopi (10.9%, a difference of 0.54%), Immigrants from Cuba (10.9%, a difference of 0.67%), and Yaqui (11.0%, a difference of 0.74%).
| Demographics | Rating | Rank | Master's Degree |
| Puget Sound Salish | 0.0 /100 | #309 | Tragic 11.1% |
| Shoshone | 0.0 /100 | #310 | Tragic 11.1% |
| Seminole | 0.0 /100 | #311 | Tragic 11.0% |
| Choctaw | 0.0 /100 | #312 | Tragic 11.0% |
| Yaqui | 0.0 /100 | #313 | Tragic 11.0% |
| Cajuns | 0.0 /100 | #314 | Tragic 11.0% |
| Apache | 0.0 /100 | #315 | Tragic 11.0% |
| Hispanics or Latinos | 0.0 /100 | #316 | Tragic 10.9% |
| Hopi | 0.0 /100 | #317 | Tragic 10.9% |
| Immigrants | Cuba | 0.0 /100 | #318 | Tragic 10.9% |
| Kiowa | 0.0 /100 | #319 | Tragic 10.8% |
| Immigrants | Micronesia | 0.0 /100 | #320 | Tragic 10.8% |
| Pennsylvania Germans | 0.0 /100 | #321 | Tragic 10.7% |
| Sioux | 0.0 /100 | #322 | Tragic 10.7% |
| Crow | 0.0 /100 | #323 | Tragic 10.6% |
Demographics Similar to Immigrants from Iran by Master's Degree
In terms of master's degree, the demographic groups most similar to Immigrants from Iran are Thai (21.7%, a difference of 0.41%), Cypriot (21.8%, a difference of 0.75%), Immigrants from China (21.2%, a difference of 2.1%), Eastern European (21.1%, a difference of 2.4%), and Iranian (22.3%, a difference of 3.0%).
| Demographics | Rating | Rank | Master's Degree |
| Immigrants | Israel | 100.0 /100 | #3 | Exceptional 22.6% |
| Okinawans | 100.0 /100 | #4 | Exceptional 22.6% |
| Immigrants | Taiwan | 100.0 /100 | #5 | Exceptional 22.5% |
| Immigrants | India | 100.0 /100 | #6 | Exceptional 22.3% |
| Iranians | 100.0 /100 | #7 | Exceptional 22.3% |
| Cypriots | 100.0 /100 | #8 | Exceptional 21.8% |
| Thais | 100.0 /100 | #9 | Exceptional 21.7% |
| Immigrants | Iran | 100.0 /100 | #10 | Exceptional 21.6% |
| Immigrants | China | 100.0 /100 | #11 | Exceptional 21.2% |
| Eastern Europeans | 100.0 /100 | #12 | Exceptional 21.1% |
| Immigrants | Australia | 100.0 /100 | #13 | Exceptional 20.9% |
| Immigrants | Switzerland | 100.0 /100 | #14 | Exceptional 20.9% |
| Immigrants | Eastern Asia | 100.0 /100 | #15 | Exceptional 20.8% |
| Immigrants | Belgium | 100.0 /100 | #16 | Exceptional 20.8% |
| Immigrants | South Central Asia | 100.0 /100 | #17 | Exceptional 20.7% |