Tongan vs Immigrants from Iran Unemployment Among Ages 20 to 24 years
COMPARE
Tongan
Immigrants from Iran
Unemployment Among Ages 20 to 24 years
Unemployment Among Ages 20 to 24 years Comparison
Tongans
Immigrants from Iran
9.4%
UNEMPLOYMENT AMONG AGES 20 TO 24 YEARS
100.0/ 100
METRIC RATING
22nd/ 347
METRIC RANK
10.8%
UNEMPLOYMENT AMONG AGES 20 TO 24 YEARS
0.9/ 100
METRIC RATING
246th/ 347
METRIC RANK
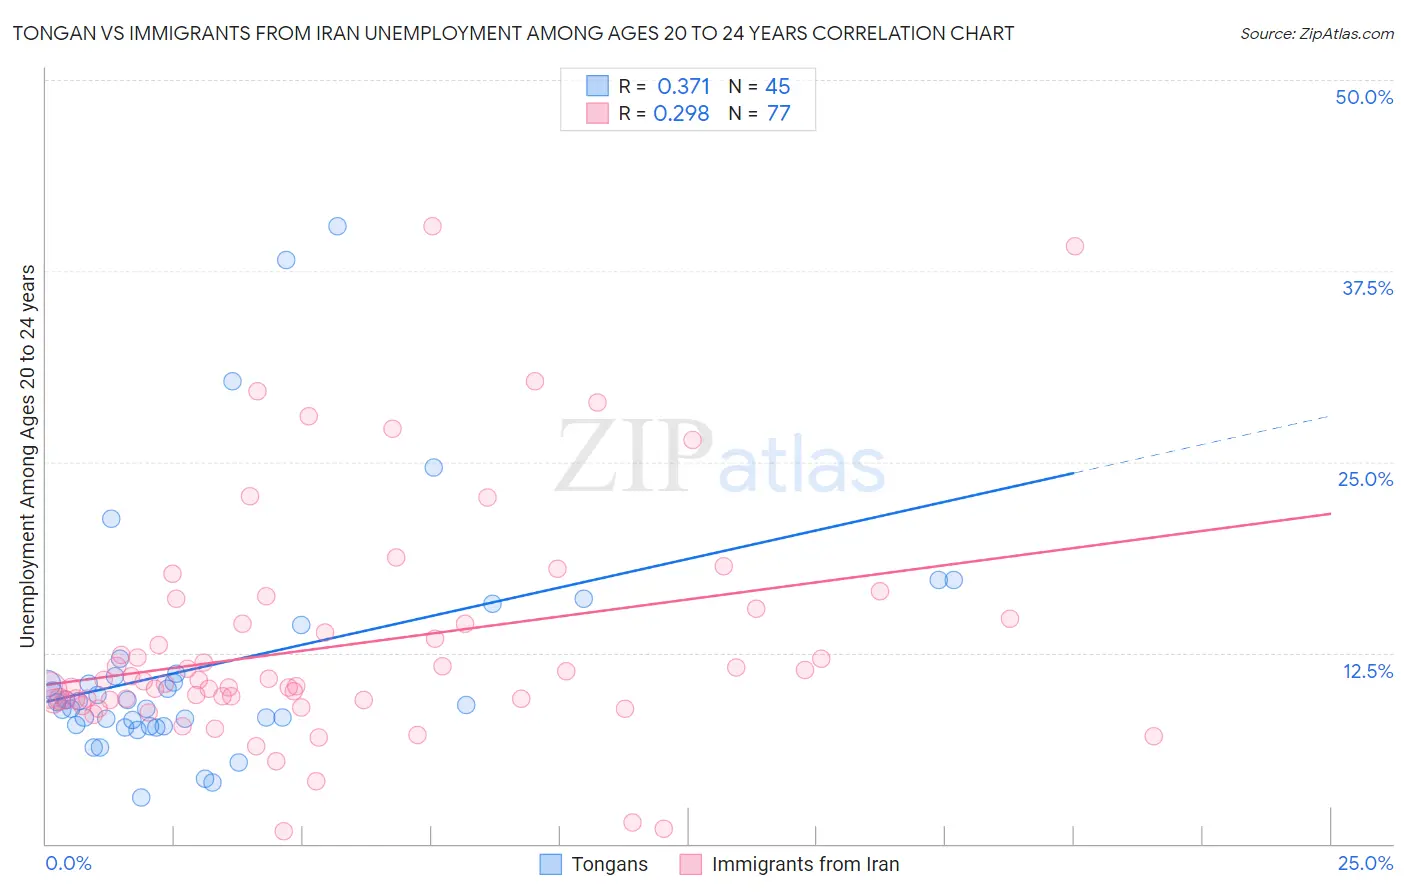
Tongan vs Immigrants from Iran Unemployment Among Ages 20 to 24 years Correlation Chart
The statistical analysis conducted on geographies consisting of 101,940,132 people shows a mild positive correlation between the proportion of Tongans and unemployment rate among population between the ages 20 and 24 in the United States with a correlation coefficient (R) of 0.371 and weighted average of 9.4%. Similarly, the statistical analysis conducted on geographies consisting of 275,046,454 people shows a weak positive correlation between the proportion of Immigrants from Iran and unemployment rate among population between the ages 20 and 24 in the United States with a correlation coefficient (R) of 0.298 and weighted average of 10.8%, a difference of 14.3%.
Unemployment Among Ages 20 to 24 years Correlation Summary
| Measurement | Tongan | Immigrants from Iran |
| Minimum | 3.0% | 0.80% |
| Maximum | 40.4% | 40.4% |
| Range | 37.4% | 39.6% |
| Mean | 11.7% | 13.0% |
| Median | 9.3% | 10.6% |
| Interquartile 25% (IQ1) | 7.7% | 9.4% |
| Interquartile 75% (IQ3) | 11.6% | 14.6% |
| Interquartile Range (IQR) | 3.8% | 5.1% |
| Standard Deviation (Sample) | 7.9% | 7.6% |
| Standard Deviation (Population) | 7.8% | 7.5% |
Similar Demographics by Unemployment Among Ages 20 to 24 years
Demographics Similar to Tongans by Unemployment Among Ages 20 to 24 years
In terms of unemployment among ages 20 to 24 years, the demographic groups most similar to Tongans are Immigrants from Nepal (9.4%, a difference of 0.0%), Immigrants from Bosnia and Herzegovina (9.4%, a difference of 0.27%), Hmong (9.4%, a difference of 0.28%), Osage (9.4%, a difference of 0.28%), and Taiwanese (9.4%, a difference of 0.31%).
| Demographics | Rating | Rank | Unemployment Among Ages 20 to 24 years |
| Immigrants | Sudan | 100.0 /100 | #15 | Exceptional 9.3% |
| Danes | 100.0 /100 | #16 | Exceptional 9.3% |
| Czechs | 100.0 /100 | #17 | Exceptional 9.3% |
| Chinese | 100.0 /100 | #18 | Exceptional 9.4% |
| Hmong | 100.0 /100 | #19 | Exceptional 9.4% |
| Osage | 100.0 /100 | #20 | Exceptional 9.4% |
| Immigrants | Bosnia and Herzegovina | 100.0 /100 | #21 | Exceptional 9.4% |
| Tongans | 100.0 /100 | #22 | Exceptional 9.4% |
| Immigrants | Nepal | 100.0 /100 | #23 | Exceptional 9.4% |
| Taiwanese | 100.0 /100 | #24 | Exceptional 9.4% |
| Immigrants | Eritrea | 100.0 /100 | #25 | Exceptional 9.5% |
| Swedes | 100.0 /100 | #26 | Exceptional 9.5% |
| Immigrants | Zimbabwe | 100.0 /100 | #27 | Exceptional 9.5% |
| Immigrants | Afghanistan | 100.0 /100 | #28 | Exceptional 9.5% |
| Immigrants | North Macedonia | 100.0 /100 | #29 | Exceptional 9.5% |
Demographics Similar to Immigrants from Iran by Unemployment Among Ages 20 to 24 years
In terms of unemployment among ages 20 to 24 years, the demographic groups most similar to Immigrants from Iran are Hispanic or Latino (10.7%, a difference of 0.13%), Immigrants from Albania (10.8%, a difference of 0.20%), Cree (10.8%, a difference of 0.30%), Immigrants from Mexico (10.7%, a difference of 0.33%), and Immigrants from Belarus (10.7%, a difference of 0.39%).
| Demographics | Rating | Rank | Unemployment Among Ages 20 to 24 years |
| Salvadorans | 2.4 /100 | #239 | Tragic 10.7% |
| Immigrants | Central America | 2.0 /100 | #240 | Tragic 10.7% |
| Immigrants | El Salvador | 1.7 /100 | #241 | Tragic 10.7% |
| Moroccans | 1.4 /100 | #242 | Tragic 10.7% |
| Immigrants | Belarus | 1.3 /100 | #243 | Tragic 10.7% |
| Immigrants | Mexico | 1.2 /100 | #244 | Tragic 10.7% |
| Hispanics or Latinos | 1.0 /100 | #245 | Tragic 10.7% |
| Immigrants | Iran | 0.9 /100 | #246 | Tragic 10.8% |
| Immigrants | Albania | 0.7 /100 | #247 | Tragic 10.8% |
| Cree | 0.6 /100 | #248 | Tragic 10.8% |
| South American Indians | 0.5 /100 | #249 | Tragic 10.8% |
| Albanians | 0.5 /100 | #250 | Tragic 10.8% |
| Immigrants | Panama | 0.4 /100 | #251 | Tragic 10.8% |
| Immigrants | Syria | 0.4 /100 | #252 | Tragic 10.8% |
| Spanish Americans | 0.4 /100 | #253 | Tragic 10.8% |