Spanish vs Immigrants from Iran 10th Grade
COMPARE
Spanish
Immigrants from Iran
10th Grade
10th Grade Comparison
Spanish
Immigrants from Iran
94.0%
10TH GRADE
74.9/ 100
METRIC RATING
155th/ 347
METRIC RANK
94.3%
10TH GRADE
94.4/ 100
METRIC RATING
126th/ 347
METRIC RANK
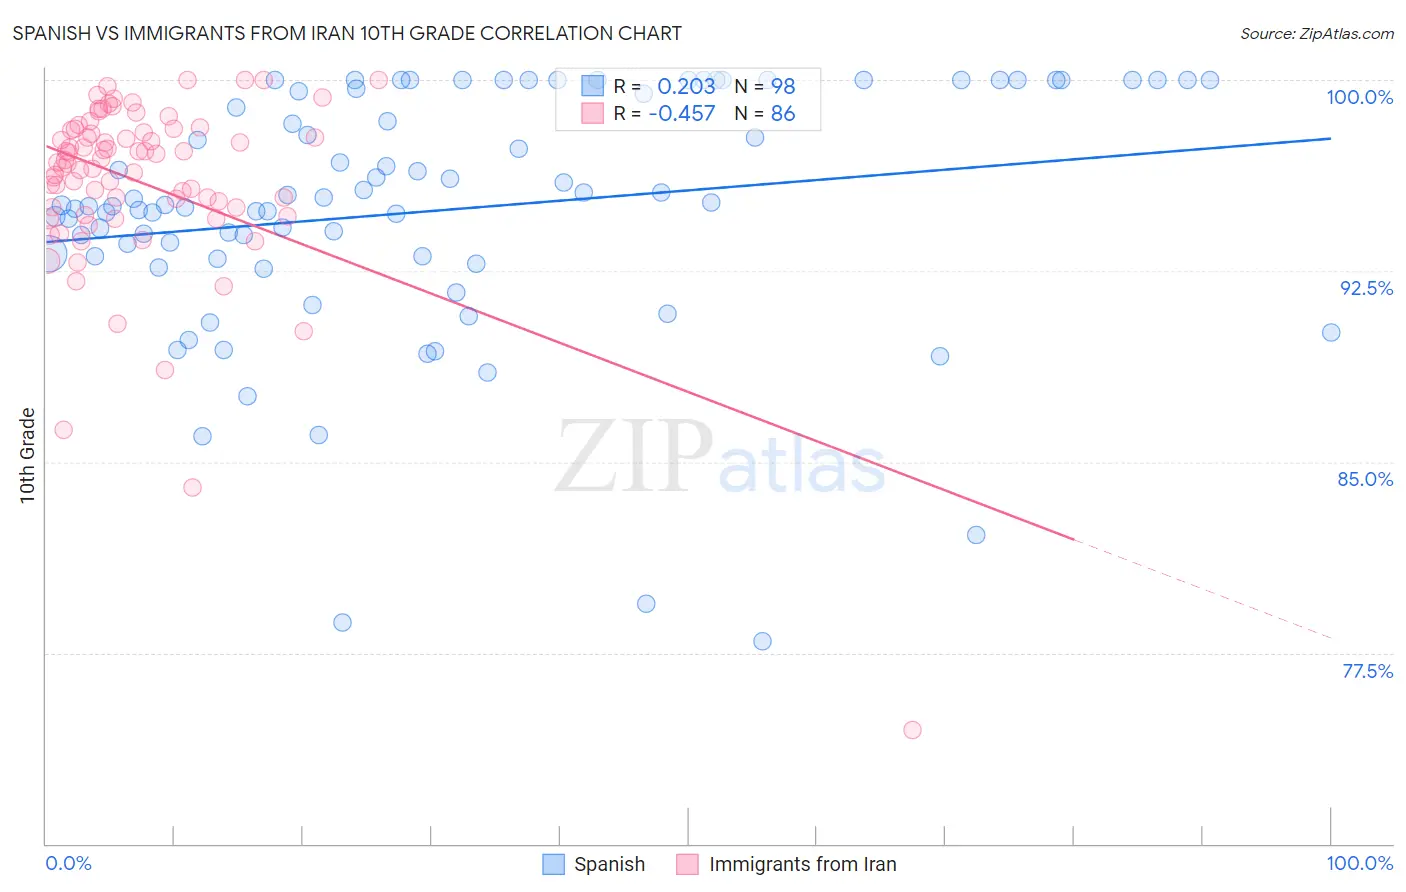
Spanish vs Immigrants from Iran 10th Grade Correlation Chart
The statistical analysis conducted on geographies consisting of 422,189,188 people shows a weak positive correlation between the proportion of Spanish and percentage of population with at least 10th grade education in the United States with a correlation coefficient (R) of 0.203 and weighted average of 94.0%. Similarly, the statistical analysis conducted on geographies consisting of 279,867,553 people shows a moderate negative correlation between the proportion of Immigrants from Iran and percentage of population with at least 10th grade education in the United States with a correlation coefficient (R) of -0.457 and weighted average of 94.3%, a difference of 0.39%.
10th Grade Correlation Summary
| Measurement | Spanish | Immigrants from Iran |
| Minimum | 77.9% | 74.5% |
| Maximum | 100.0% | 100.0% |
| Range | 22.1% | 25.5% |
| Mean | 94.9% | 96.0% |
| Median | 95.1% | 96.8% |
| Interquartile 25% (IQ1) | 93.1% | 95.0% |
| Interquartile 75% (IQ3) | 99.7% | 98.0% |
| Interquartile Range (IQR) | 6.6% | 3.0% |
| Standard Deviation (Sample) | 4.9% | 3.7% |
| Standard Deviation (Population) | 4.8% | 3.7% |
Similar Demographics by 10th Grade
Demographics Similar to Spanish by 10th Grade
In terms of 10th grade, the demographic groups most similar to Spanish are Immigrants from Kenya (94.0%, a difference of 0.0%), Immigrants from Brazil (94.0%, a difference of 0.010%), Mongolian (94.0%, a difference of 0.010%), Kiowa (93.9%, a difference of 0.020%), and Immigrants from Italy (94.0%, a difference of 0.040%).
| Demographics | Rating | Rank | 10th Grade |
| Arabs | 80.9 /100 | #148 | Excellent 94.0% |
| Ugandans | 80.7 /100 | #149 | Excellent 94.0% |
| Egyptians | 79.6 /100 | #150 | Good 94.0% |
| Kenyans | 79.1 /100 | #151 | Good 94.0% |
| Immigrants | Italy | 78.0 /100 | #152 | Good 94.0% |
| Immigrants | Brazil | 75.5 /100 | #153 | Good 94.0% |
| Immigrants | Kenya | 75.3 /100 | #154 | Good 94.0% |
| Spanish | 74.9 /100 | #155 | Good 94.0% |
| Mongolians | 74.4 /100 | #156 | Good 94.0% |
| Kiowa | 73.3 /100 | #157 | Good 93.9% |
| Bermudans | 71.0 /100 | #158 | Good 93.9% |
| Chileans | 70.2 /100 | #159 | Good 93.9% |
| Pakistanis | 70.1 /100 | #160 | Good 93.9% |
| Assyrians/Chaldeans/Syriacs | 69.7 /100 | #161 | Good 93.9% |
| Immigrants | Poland | 69.6 /100 | #162 | Good 93.9% |
Demographics Similar to Immigrants from Iran by 10th Grade
In terms of 10th grade, the demographic groups most similar to Immigrants from Iran are American (94.3%, a difference of 0.0%), Basque (94.3%, a difference of 0.020%), Israeli (94.3%, a difference of 0.020%), Inupiat (94.4%, a difference of 0.030%), and Cree (94.4%, a difference of 0.030%).
| Demographics | Rating | Rank | 10th Grade |
| Immigrants | Israel | 95.4 /100 | #119 | Exceptional 94.4% |
| Immigrants | Taiwan | 95.3 /100 | #120 | Exceptional 94.4% |
| Immigrants | Belarus | 95.2 /100 | #121 | Exceptional 94.4% |
| Inupiat | 95.1 /100 | #122 | Exceptional 94.4% |
| Cree | 95.1 /100 | #123 | Exceptional 94.4% |
| Basques | 94.9 /100 | #124 | Exceptional 94.3% |
| Americans | 94.4 /100 | #125 | Exceptional 94.3% |
| Immigrants | Iran | 94.4 /100 | #126 | Exceptional 94.3% |
| Israelis | 93.8 /100 | #127 | Exceptional 94.3% |
| Potawatomi | 93.6 /100 | #128 | Exceptional 94.3% |
| Iroquois | 92.8 /100 | #129 | Exceptional 94.3% |
| Immigrants | Greece | 92.7 /100 | #130 | Exceptional 94.3% |
| Immigrants | Eastern Europe | 92.5 /100 | #131 | Exceptional 94.3% |
| Immigrants | Russia | 92.4 /100 | #132 | Exceptional 94.3% |
| Creek | 91.9 /100 | #133 | Exceptional 94.2% |