Okinawan vs Immigrants from Iran 10th Grade
COMPARE
Okinawan
Immigrants from Iran
10th Grade
10th Grade Comparison
Okinawans
Immigrants from Iran
94.8%
10TH GRADE
99.5/ 100
METRIC RATING
75th/ 347
METRIC RANK
94.3%
10TH GRADE
94.4/ 100
METRIC RATING
126th/ 347
METRIC RANK
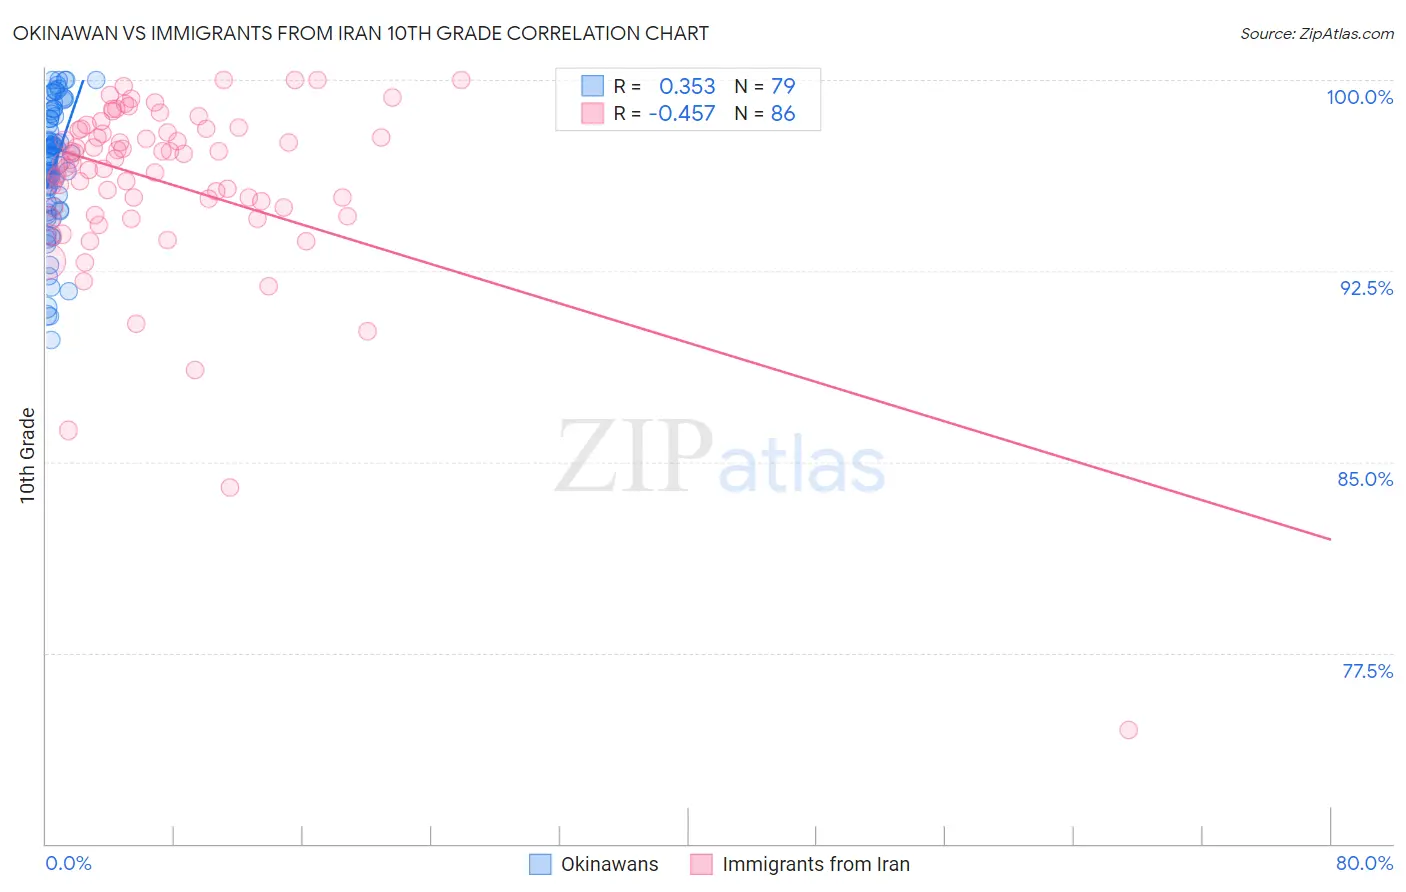
Okinawan vs Immigrants from Iran 10th Grade Correlation Chart
The statistical analysis conducted on geographies consisting of 73,779,368 people shows a mild positive correlation between the proportion of Okinawans and percentage of population with at least 10th grade education in the United States with a correlation coefficient (R) of 0.353 and weighted average of 94.8%. Similarly, the statistical analysis conducted on geographies consisting of 279,867,553 people shows a moderate negative correlation between the proportion of Immigrants from Iran and percentage of population with at least 10th grade education in the United States with a correlation coefficient (R) of -0.457 and weighted average of 94.3%, a difference of 0.55%.
10th Grade Correlation Summary
| Measurement | Okinawan | Immigrants from Iran |
| Minimum | 89.8% | 74.5% |
| Maximum | 100.0% | 100.0% |
| Range | 10.2% | 25.5% |
| Mean | 96.6% | 96.0% |
| Median | 96.8% | 96.8% |
| Interquartile 25% (IQ1) | 95.1% | 95.0% |
| Interquartile 75% (IQ3) | 98.6% | 98.0% |
| Interquartile Range (IQR) | 3.5% | 3.0% |
| Standard Deviation (Sample) | 2.5% | 3.7% |
| Standard Deviation (Population) | 2.5% | 3.7% |
Similar Demographics by 10th Grade
Demographics Similar to Okinawans by 10th Grade
In terms of 10th grade, the demographic groups most similar to Okinawans are Romanian (94.8%, a difference of 0.010%), Immigrants from South Africa (94.8%, a difference of 0.010%), Bhutanese (94.9%, a difference of 0.030%), Canadian (94.9%, a difference of 0.030%), and Immigrants from Sweden (94.9%, a difference of 0.040%).
| Demographics | Rating | Rank | 10th Grade |
| Immigrants | Belgium | 99.7 /100 | #68 | Exceptional 94.9% |
| Immigrants | England | 99.6 /100 | #69 | Exceptional 94.9% |
| Zimbabweans | 99.6 /100 | #70 | Exceptional 94.9% |
| Alaska Natives | 99.6 /100 | #71 | Exceptional 94.9% |
| Immigrants | Sweden | 99.6 /100 | #72 | Exceptional 94.9% |
| Bhutanese | 99.6 /100 | #73 | Exceptional 94.9% |
| Canadians | 99.6 /100 | #74 | Exceptional 94.9% |
| Okinawans | 99.5 /100 | #75 | Exceptional 94.8% |
| Romanians | 99.5 /100 | #76 | Exceptional 94.8% |
| Immigrants | South Africa | 99.5 /100 | #77 | Exceptional 94.8% |
| Filipinos | 99.3 /100 | #78 | Exceptional 94.8% |
| Immigrants | Czechoslovakia | 99.2 /100 | #79 | Exceptional 94.7% |
| Immigrants | Denmark | 99.2 /100 | #80 | Exceptional 94.7% |
| Immigrants | Latvia | 99.2 /100 | #81 | Exceptional 94.7% |
| Swiss | 99.1 /100 | #82 | Exceptional 94.7% |
Demographics Similar to Immigrants from Iran by 10th Grade
In terms of 10th grade, the demographic groups most similar to Immigrants from Iran are American (94.3%, a difference of 0.0%), Basque (94.3%, a difference of 0.020%), Israeli (94.3%, a difference of 0.020%), Inupiat (94.4%, a difference of 0.030%), and Cree (94.4%, a difference of 0.030%).
| Demographics | Rating | Rank | 10th Grade |
| Immigrants | Israel | 95.4 /100 | #119 | Exceptional 94.4% |
| Immigrants | Taiwan | 95.3 /100 | #120 | Exceptional 94.4% |
| Immigrants | Belarus | 95.2 /100 | #121 | Exceptional 94.4% |
| Inupiat | 95.1 /100 | #122 | Exceptional 94.4% |
| Cree | 95.1 /100 | #123 | Exceptional 94.4% |
| Basques | 94.9 /100 | #124 | Exceptional 94.3% |
| Americans | 94.4 /100 | #125 | Exceptional 94.3% |
| Immigrants | Iran | 94.4 /100 | #126 | Exceptional 94.3% |
| Israelis | 93.8 /100 | #127 | Exceptional 94.3% |
| Potawatomi | 93.6 /100 | #128 | Exceptional 94.3% |
| Iroquois | 92.8 /100 | #129 | Exceptional 94.3% |
| Immigrants | Greece | 92.7 /100 | #130 | Exceptional 94.3% |
| Immigrants | Eastern Europe | 92.5 /100 | #131 | Exceptional 94.3% |
| Immigrants | Russia | 92.4 /100 | #132 | Exceptional 94.3% |
| Creek | 91.9 /100 | #133 | Exceptional 94.2% |