Tongan vs Immigrants from Cabo Verde Female Disability
COMPARE
Tongan
Immigrants from Cabo Verde
Female Disability
Female Disability Comparison
Tongans
Immigrants from Cabo Verde
11.3%
FEMALE DISABILITY
100.0/ 100
METRIC RATING
49th/ 347
METRIC RANK
14.6%
FEMALE DISABILITY
0.0/ 100
METRIC RATING
331st/ 347
METRIC RANK
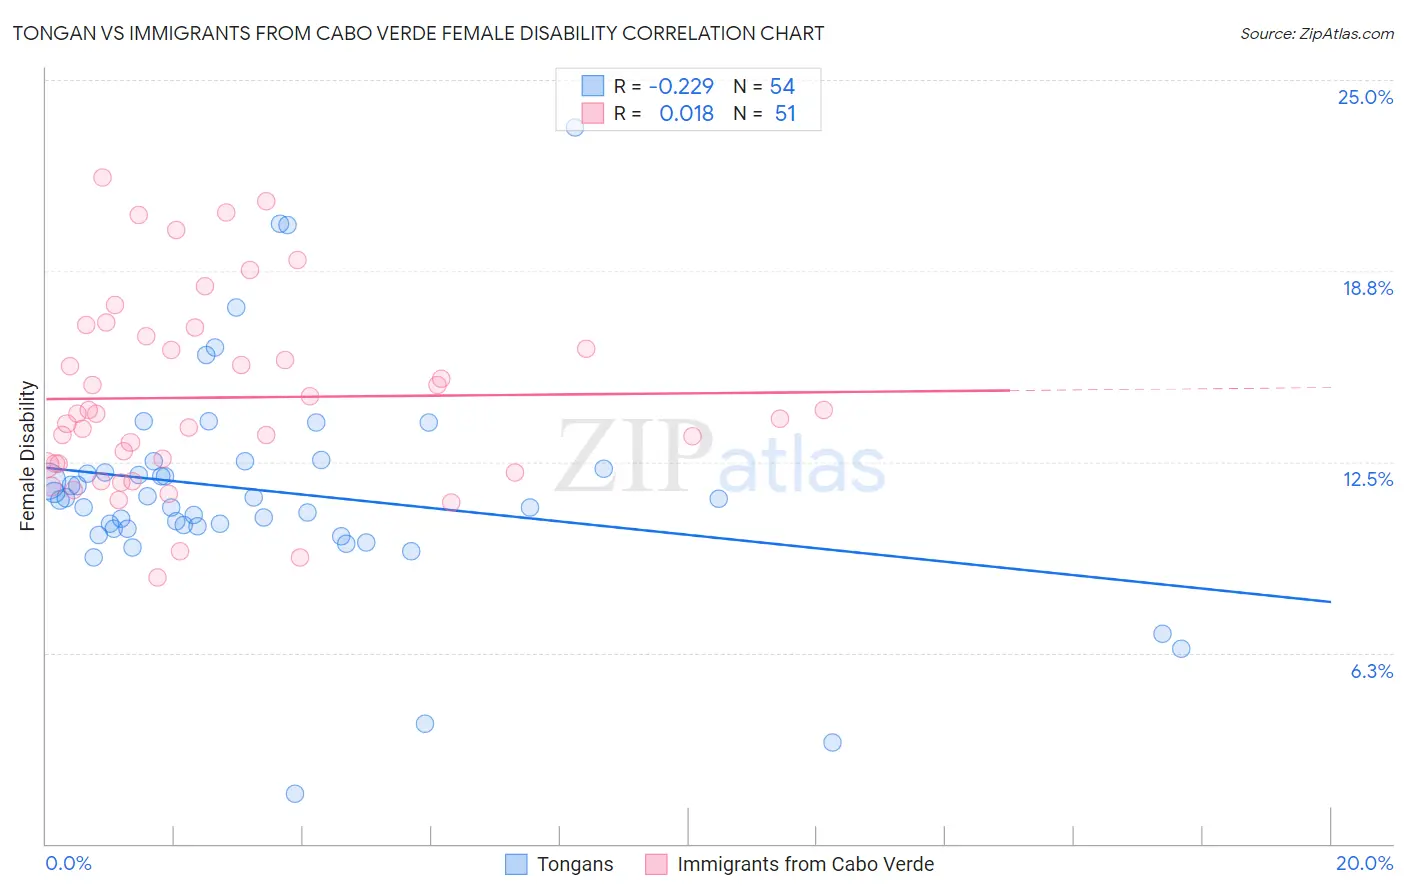
Tongan vs Immigrants from Cabo Verde Female Disability Correlation Chart
The statistical analysis conducted on geographies consisting of 102,892,967 people shows a weak negative correlation between the proportion of Tongans and percentage of females with a disability in the United States with a correlation coefficient (R) of -0.229 and weighted average of 11.3%. Similarly, the statistical analysis conducted on geographies consisting of 38,139,523 people shows no correlation between the proportion of Immigrants from Cabo Verde and percentage of females with a disability in the United States with a correlation coefficient (R) of 0.018 and weighted average of 14.6%, a difference of 29.1%.
Female Disability Correlation Summary
| Measurement | Tongan | Immigrants from Cabo Verde |
| Minimum | 1.6% | 8.7% |
| Maximum | 23.4% | 21.8% |
| Range | 21.8% | 13.1% |
| Mean | 11.5% | 14.6% |
| Median | 11.3% | 14.1% |
| Interquartile 25% (IQ1) | 10.3% | 12.4% |
| Interquartile 75% (IQ3) | 12.3% | 16.6% |
| Interquartile Range (IQR) | 1.9% | 4.2% |
| Standard Deviation (Sample) | 3.6% | 3.1% |
| Standard Deviation (Population) | 3.6% | 3.1% |
Similar Demographics by Female Disability
Demographics Similar to Tongans by Female Disability
In terms of female disability, the demographic groups most similar to Tongans are Jordanian (11.3%, a difference of 0.010%), Zimbabwean (11.3%, a difference of 0.010%), Immigrants from Nepal (11.3%, a difference of 0.030%), Immigrants from Sweden (11.3%, a difference of 0.080%), and Cambodian (11.3%, a difference of 0.12%).
| Demographics | Rating | Rank | Female Disability |
| Israelis | 100.0 /100 | #42 | Exceptional 11.2% |
| Afghans | 100.0 /100 | #43 | Exceptional 11.2% |
| Cambodians | 100.0 /100 | #44 | Exceptional 11.3% |
| Immigrants | Sweden | 100.0 /100 | #45 | Exceptional 11.3% |
| Immigrants | Nepal | 100.0 /100 | #46 | Exceptional 11.3% |
| Jordanians | 100.0 /100 | #47 | Exceptional 11.3% |
| Zimbabweans | 100.0 /100 | #48 | Exceptional 11.3% |
| Tongans | 100.0 /100 | #49 | Exceptional 11.3% |
| Inupiat | 100.0 /100 | #50 | Exceptional 11.3% |
| Immigrants | Belgium | 100.0 /100 | #51 | Exceptional 11.3% |
| Immigrants | Peru | 99.9 /100 | #52 | Exceptional 11.3% |
| Immigrants | Saudi Arabia | 99.9 /100 | #53 | Exceptional 11.3% |
| Peruvians | 99.9 /100 | #54 | Exceptional 11.3% |
| Bulgarians | 99.9 /100 | #55 | Exceptional 11.3% |
| Taiwanese | 99.9 /100 | #56 | Exceptional 11.4% |
Demographics Similar to Immigrants from Cabo Verde by Female Disability
In terms of female disability, the demographic groups most similar to Immigrants from Cabo Verde are Yuman (14.5%, a difference of 0.42%), Pima (14.8%, a difference of 1.6%), Osage (14.3%, a difference of 1.8%), Immigrants from the Azores (14.9%, a difference of 2.0%), and Cherokee (14.9%, a difference of 2.1%).
| Demographics | Rating | Rank | Female Disability |
| Natives/Alaskans | 0.0 /100 | #324 | Tragic 14.1% |
| Navajo | 0.0 /100 | #325 | Tragic 14.2% |
| Comanche | 0.0 /100 | #326 | Tragic 14.2% |
| Ottawa | 0.0 /100 | #327 | Tragic 14.2% |
| Cape Verdeans | 0.0 /100 | #328 | Tragic 14.2% |
| Osage | 0.0 /100 | #329 | Tragic 14.3% |
| Yuman | 0.0 /100 | #330 | Tragic 14.5% |
| Immigrants | Cabo Verde | 0.0 /100 | #331 | Tragic 14.6% |
| Pima | 0.0 /100 | #332 | Tragic 14.8% |
| Immigrants | Azores | 0.0 /100 | #333 | Tragic 14.9% |
| Cherokee | 0.0 /100 | #334 | Tragic 14.9% |
| Cajuns | 0.0 /100 | #335 | Tragic 14.9% |
| Seminole | 0.0 /100 | #336 | Tragic 15.0% |
| Tohono O'odham | 0.0 /100 | #337 | Tragic 15.0% |
| Dutch West Indians | 0.0 /100 | #338 | Tragic 15.0% |