Iroquois vs Korean No Schooling Completed
COMPARE
Iroquois
Korean
No Schooling Completed
No Schooling Completed Comparison
Iroquois
Koreans
1.9%
NO SCHOOLING COMPLETED
95.1/ 100
METRIC RATING
119th/ 347
METRIC RANK
2.4%
NO SCHOOLING COMPLETED
1.7/ 100
METRIC RATING
241st/ 347
METRIC RANK
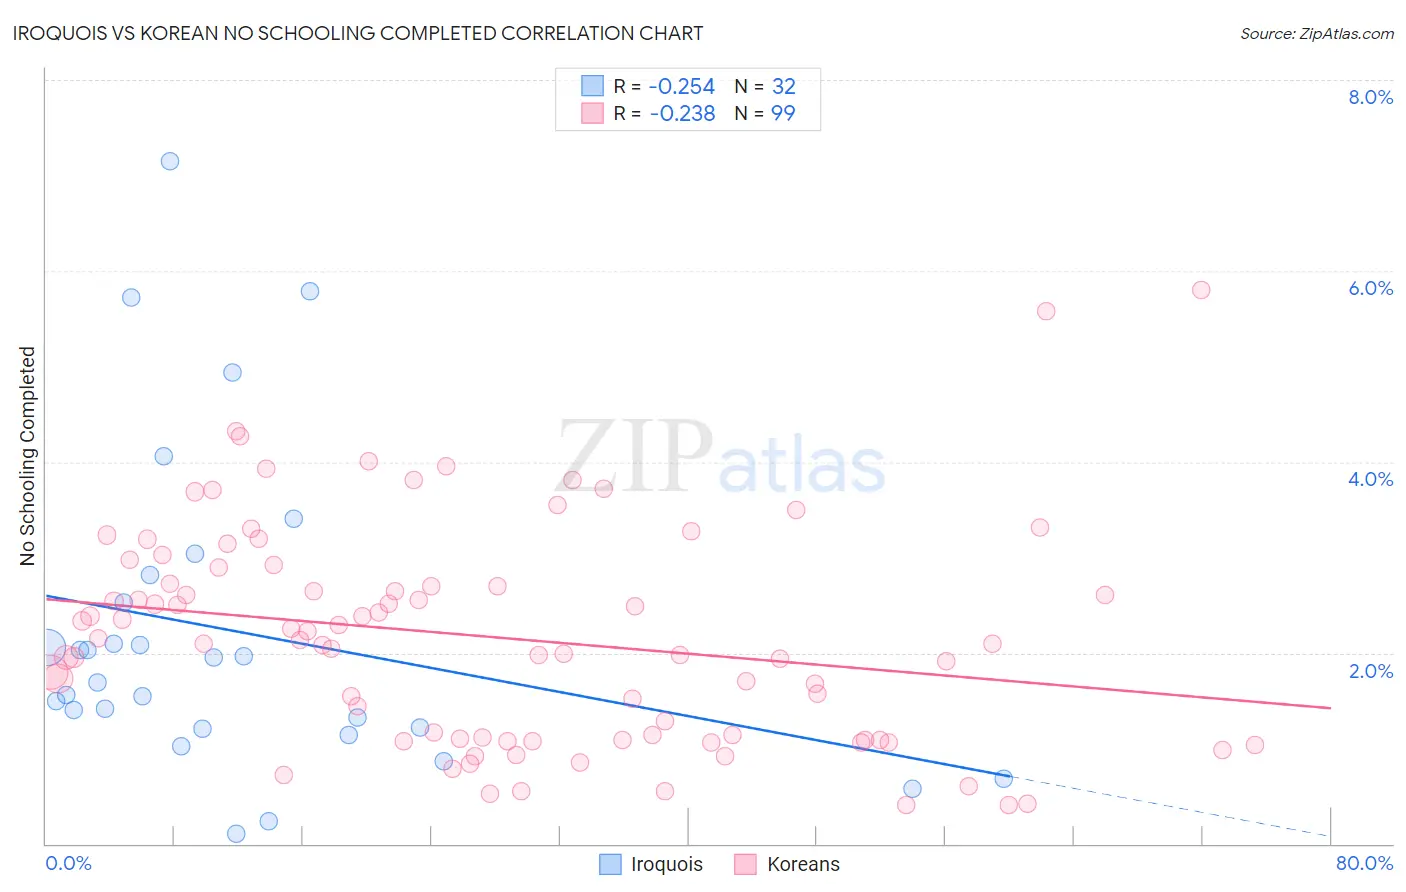
Iroquois vs Korean No Schooling Completed Correlation Chart
The statistical analysis conducted on geographies consisting of 205,850,769 people shows a weak negative correlation between the proportion of Iroquois and percentage of population with no schooling in the United States with a correlation coefficient (R) of -0.254 and weighted average of 1.9%. Similarly, the statistical analysis conducted on geographies consisting of 502,061,970 people shows a weak negative correlation between the proportion of Koreans and percentage of population with no schooling in the United States with a correlation coefficient (R) of -0.238 and weighted average of 2.4%, a difference of 26.3%.
No Schooling Completed Correlation Summary
| Measurement | Iroquois | Korean |
| Minimum | 0.10% | 0.40% |
| Maximum | 7.1% | 5.8% |
| Range | 7.0% | 5.4% |
| Mean | 2.2% | 2.2% |
| Median | 1.8% | 2.1% |
| Interquartile 25% (IQ1) | 1.2% | 1.1% |
| Interquartile 75% (IQ3) | 2.7% | 2.9% |
| Interquartile Range (IQR) | 1.5% | 1.8% |
| Standard Deviation (Sample) | 1.7% | 1.1% |
| Standard Deviation (Population) | 1.6% | 1.1% |
Similar Demographics by No Schooling Completed
Demographics Similar to Iroquois by No Schooling Completed
In terms of no schooling completed, the demographic groups most similar to Iroquois are Spanish (1.9%, a difference of 0.35%), Immigrants from Bulgaria (1.9%, a difference of 0.40%), Immigrants from Croatia (1.9%, a difference of 0.47%), Cree (1.9%, a difference of 0.50%), and Immigrants from Serbia (1.9%, a difference of 0.58%).
| Demographics | Rating | Rank | No Schooling Completed |
| Pueblo | 96.4 /100 | #112 | Exceptional 1.9% |
| Immigrants | Zimbabwe | 96.2 /100 | #113 | Exceptional 1.9% |
| Immigrants | Norway | 96.1 /100 | #114 | Exceptional 1.9% |
| Syrians | 96.0 /100 | #115 | Exceptional 1.9% |
| Lebanese | 96.0 /100 | #116 | Exceptional 1.9% |
| Immigrants | Serbia | 95.8 /100 | #117 | Exceptional 1.9% |
| Spanish | 95.5 /100 | #118 | Exceptional 1.9% |
| Iroquois | 95.1 /100 | #119 | Exceptional 1.9% |
| Immigrants | Bulgaria | 94.6 /100 | #120 | Exceptional 1.9% |
| Immigrants | Croatia | 94.5 /100 | #121 | Exceptional 1.9% |
| Cree | 94.5 /100 | #122 | Exceptional 1.9% |
| Immigrants | Kuwait | 93.9 /100 | #123 | Exceptional 1.9% |
| Cambodians | 93.8 /100 | #124 | Exceptional 1.9% |
| Immigrants | Europe | 93.7 /100 | #125 | Exceptional 1.9% |
| Immigrants | Romania | 92.6 /100 | #126 | Exceptional 1.9% |
Demographics Similar to Koreans by No Schooling Completed
In terms of no schooling completed, the demographic groups most similar to Koreans are Immigrants from Senegal (2.4%, a difference of 0.060%), Liberian (2.4%, a difference of 0.29%), Immigrants from Indonesia (2.4%, a difference of 0.32%), South American (2.4%, a difference of 0.36%), and Paiute (2.4%, a difference of 0.41%).
| Demographics | Rating | Rank | No Schooling Completed |
| Nigerians | 2.6 /100 | #234 | Tragic 2.3% |
| Immigrants | Western Asia | 2.6 /100 | #235 | Tragic 2.3% |
| Iraqis | 2.2 /100 | #236 | Tragic 2.4% |
| Immigrants | Eastern Asia | 2.0 /100 | #237 | Tragic 2.4% |
| Paiute | 1.9 /100 | #238 | Tragic 2.4% |
| Liberians | 1.8 /100 | #239 | Tragic 2.4% |
| Immigrants | Senegal | 1.7 /100 | #240 | Tragic 2.4% |
| Koreans | 1.7 /100 | #241 | Tragic 2.4% |
| Immigrants | Indonesia | 1.5 /100 | #242 | Tragic 2.4% |
| South Americans | 1.5 /100 | #243 | Tragic 2.4% |
| Peruvians | 1.4 /100 | #244 | Tragic 2.4% |
| Bolivians | 1.4 /100 | #245 | Tragic 2.4% |
| Immigrants | Congo | 1.4 /100 | #246 | Tragic 2.4% |
| Immigrants | Iraq | 1.3 /100 | #247 | Tragic 2.4% |
| Asians | 1.2 /100 | #248 | Tragic 2.4% |