Okinawan vs Korean No Schooling Completed
COMPARE
Okinawan
Korean
No Schooling Completed
No Schooling Completed Comparison
Okinawans
Koreans
1.8%
NO SCHOOLING COMPLETED
97.1/ 100
METRIC RATING
108th/ 347
METRIC RANK
2.4%
NO SCHOOLING COMPLETED
1.7/ 100
METRIC RATING
241st/ 347
METRIC RANK
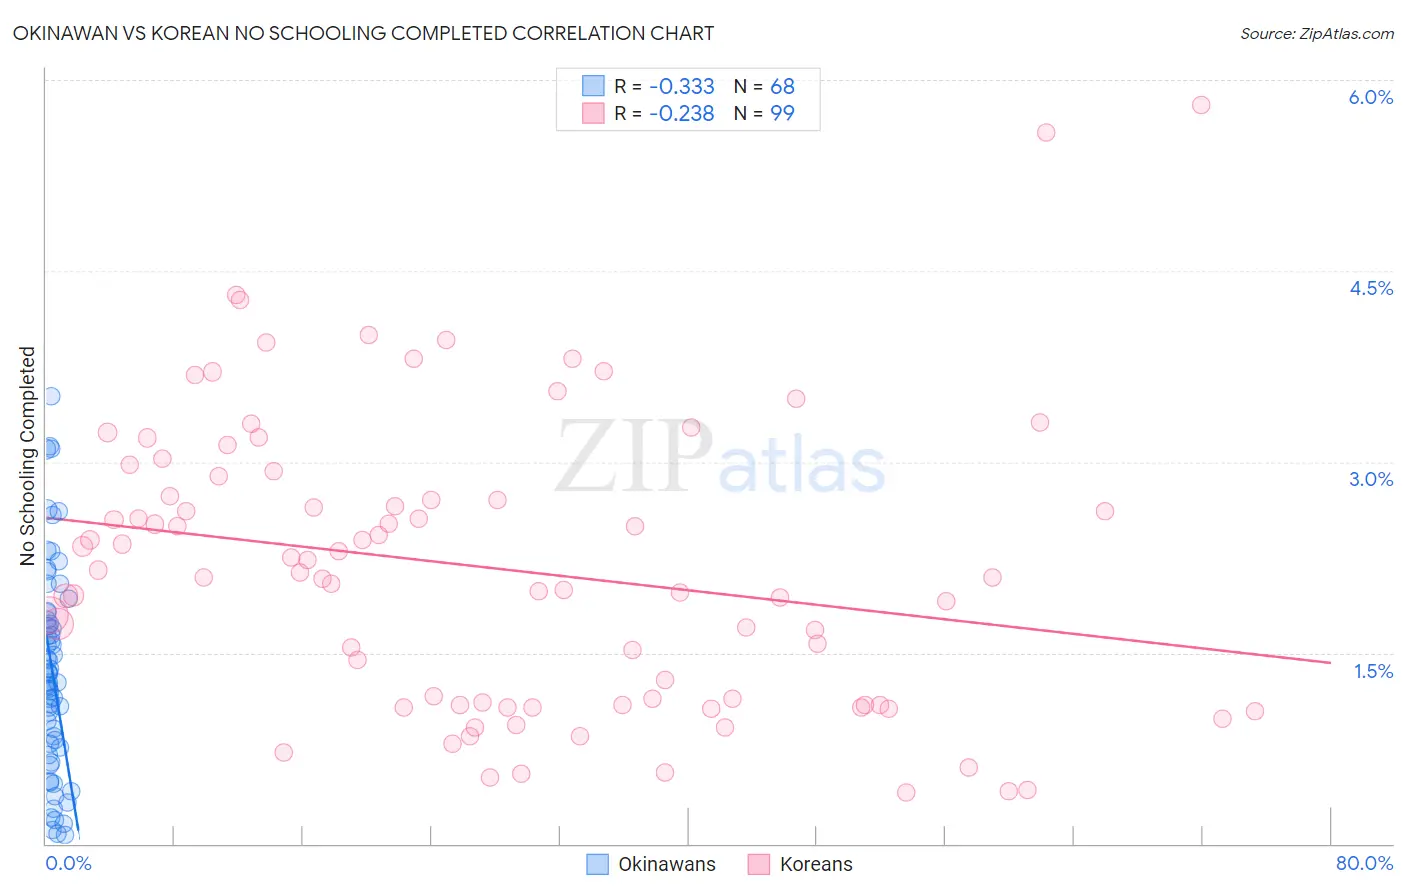
Okinawan vs Korean No Schooling Completed Correlation Chart
The statistical analysis conducted on geographies consisting of 73,597,304 people shows a mild negative correlation between the proportion of Okinawans and percentage of population with no schooling in the United States with a correlation coefficient (R) of -0.333 and weighted average of 1.8%. Similarly, the statistical analysis conducted on geographies consisting of 502,061,970 people shows a weak negative correlation between the proportion of Koreans and percentage of population with no schooling in the United States with a correlation coefficient (R) of -0.238 and weighted average of 2.4%, a difference of 28.8%.
No Schooling Completed Correlation Summary
| Measurement | Okinawan | Korean |
| Minimum | 0.067% | 0.40% |
| Maximum | 3.5% | 5.8% |
| Range | 3.5% | 5.4% |
| Mean | 1.4% | 2.2% |
| Median | 1.3% | 2.1% |
| Interquartile 25% (IQ1) | 0.77% | 1.1% |
| Interquartile 75% (IQ3) | 1.8% | 2.9% |
| Interquartile Range (IQR) | 1.0% | 1.8% |
| Standard Deviation (Sample) | 0.81% | 1.1% |
| Standard Deviation (Population) | 0.80% | 1.1% |
Similar Demographics by No Schooling Completed
Demographics Similar to Okinawans by No Schooling Completed
In terms of no schooling completed, the demographic groups most similar to Okinawans are Yugoslavian (1.8%, a difference of 0.22%), Immigrants from France (1.8%, a difference of 0.26%), Immigrants from Saudi Arabia (1.9%, a difference of 0.35%), Immigrants from Latvia (1.9%, a difference of 0.48%), and Immigrants from Japan (1.9%, a difference of 0.63%).
| Demographics | Rating | Rank | No Schooling Completed |
| Immigrants | Czechoslovakia | 97.9 /100 | #101 | Exceptional 1.8% |
| Immigrants | Switzerland | 97.9 /100 | #102 | Exceptional 1.8% |
| Basques | 97.9 /100 | #103 | Exceptional 1.8% |
| Thais | 97.5 /100 | #104 | Exceptional 1.8% |
| German Russians | 97.5 /100 | #105 | Exceptional 1.8% |
| Immigrants | France | 97.3 /100 | #106 | Exceptional 1.8% |
| Yugoslavians | 97.2 /100 | #107 | Exceptional 1.8% |
| Okinawans | 97.1 /100 | #108 | Exceptional 1.8% |
| Immigrants | Saudi Arabia | 96.8 /100 | #109 | Exceptional 1.9% |
| Immigrants | Latvia | 96.7 /100 | #110 | Exceptional 1.9% |
| Immigrants | Japan | 96.6 /100 | #111 | Exceptional 1.9% |
| Pueblo | 96.4 /100 | #112 | Exceptional 1.9% |
| Immigrants | Zimbabwe | 96.2 /100 | #113 | Exceptional 1.9% |
| Immigrants | Norway | 96.1 /100 | #114 | Exceptional 1.9% |
| Syrians | 96.0 /100 | #115 | Exceptional 1.9% |
Demographics Similar to Koreans by No Schooling Completed
In terms of no schooling completed, the demographic groups most similar to Koreans are Immigrants from Senegal (2.4%, a difference of 0.060%), Liberian (2.4%, a difference of 0.29%), Immigrants from Indonesia (2.4%, a difference of 0.32%), South American (2.4%, a difference of 0.36%), and Paiute (2.4%, a difference of 0.41%).
| Demographics | Rating | Rank | No Schooling Completed |
| Nigerians | 2.6 /100 | #234 | Tragic 2.3% |
| Immigrants | Western Asia | 2.6 /100 | #235 | Tragic 2.3% |
| Iraqis | 2.2 /100 | #236 | Tragic 2.4% |
| Immigrants | Eastern Asia | 2.0 /100 | #237 | Tragic 2.4% |
| Paiute | 1.9 /100 | #238 | Tragic 2.4% |
| Liberians | 1.8 /100 | #239 | Tragic 2.4% |
| Immigrants | Senegal | 1.7 /100 | #240 | Tragic 2.4% |
| Koreans | 1.7 /100 | #241 | Tragic 2.4% |
| Immigrants | Indonesia | 1.5 /100 | #242 | Tragic 2.4% |
| South Americans | 1.5 /100 | #243 | Tragic 2.4% |
| Peruvians | 1.4 /100 | #244 | Tragic 2.4% |
| Bolivians | 1.4 /100 | #245 | Tragic 2.4% |
| Immigrants | Congo | 1.4 /100 | #246 | Tragic 2.4% |
| Immigrants | Iraq | 1.3 /100 | #247 | Tragic 2.4% |
| Asians | 1.2 /100 | #248 | Tragic 2.4% |