Tlingit-Haida vs Creek 9th Grade
COMPARE
Tlingit-Haida
Creek
9th Grade
9th Grade Comparison
Tlingit-Haida
Creek
96.6%
9TH GRADE
100.0/ 100
METRIC RATING
9th/ 347
METRIC RANK
95.6%
9TH GRADE
98.8/ 100
METRIC RATING
91st/ 347
METRIC RANK
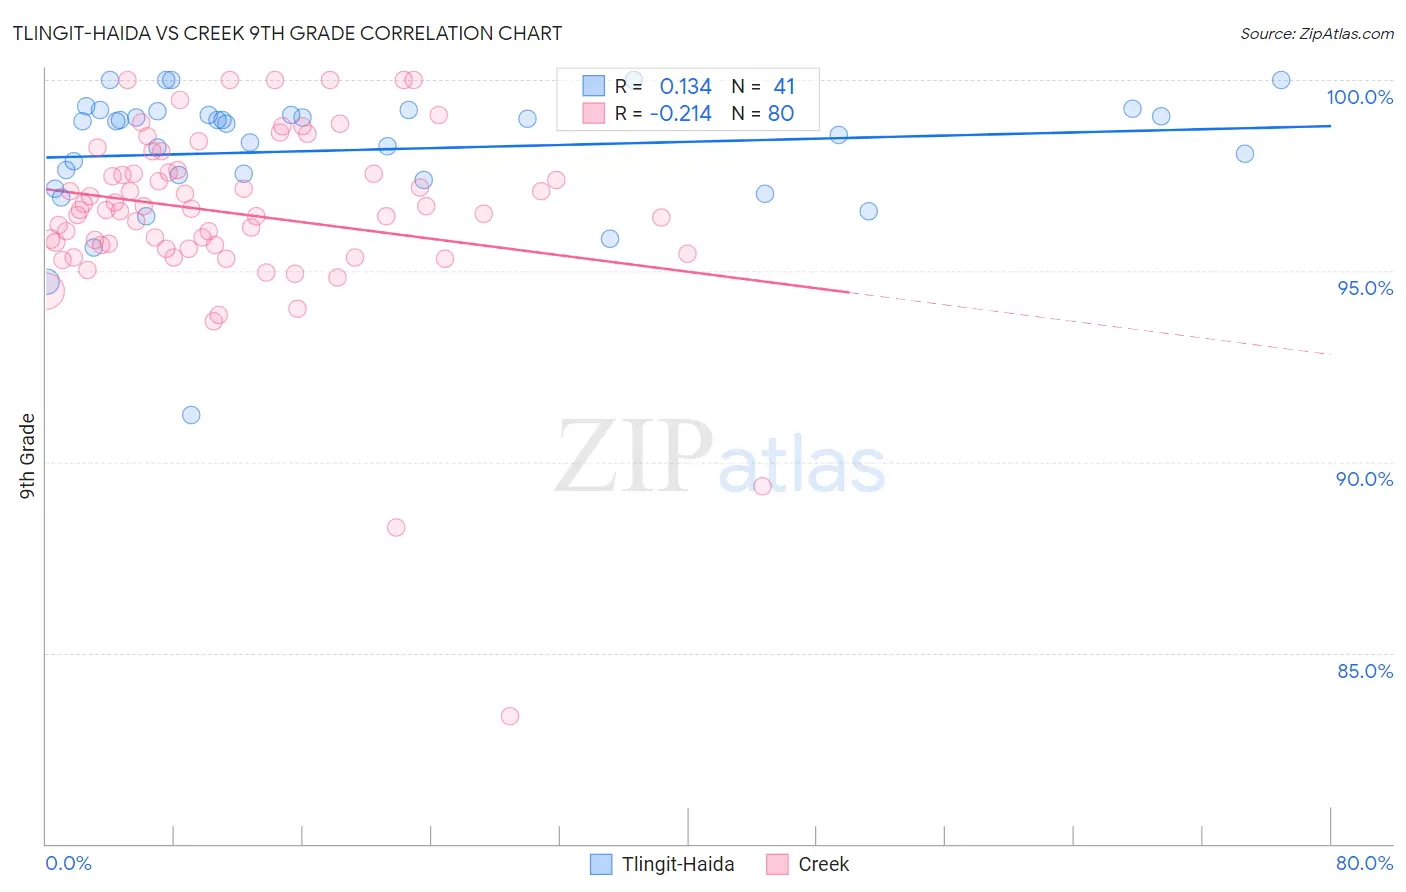
Tlingit-Haida vs Creek 9th Grade Correlation Chart
The statistical analysis conducted on geographies consisting of 60,871,919 people shows a poor positive correlation between the proportion of Tlingit-Haida and percentage of population with at least 9th grade education in the United States with a correlation coefficient (R) of 0.134 and weighted average of 96.6%. Similarly, the statistical analysis conducted on geographies consisting of 178,480,629 people shows a weak negative correlation between the proportion of Creek and percentage of population with at least 9th grade education in the United States with a correlation coefficient (R) of -0.214 and weighted average of 95.6%, a difference of 1.0%.
9th Grade Correlation Summary
| Measurement | Tlingit-Haida | Creek |
| Minimum | 91.2% | 83.3% |
| Maximum | 100.0% | 100.0% |
| Range | 8.8% | 16.7% |
| Mean | 98.2% | 96.5% |
| Median | 98.9% | 96.6% |
| Interquartile 25% (IQ1) | 97.4% | 95.6% |
| Interquartile 75% (IQ3) | 99.1% | 97.6% |
| Interquartile Range (IQR) | 1.7% | 2.0% |
| Standard Deviation (Sample) | 1.7% | 2.5% |
| Standard Deviation (Population) | 1.7% | 2.5% |
Similar Demographics by 9th Grade
Demographics Similar to Tlingit-Haida by 9th Grade
In terms of 9th grade, the demographic groups most similar to Tlingit-Haida are Lithuanian (96.6%, a difference of 0.040%), Finnish (96.6%, a difference of 0.040%), English (96.6%, a difference of 0.060%), German (96.7%, a difference of 0.080%), and Carpatho Rusyn (96.7%, a difference of 0.090%).
| Demographics | Rating | Rank | 9th Grade |
| Norwegians | 100.0 /100 | #2 | Exceptional 96.9% |
| Slovaks | 100.0 /100 | #3 | Exceptional 96.9% |
| Slovenes | 100.0 /100 | #4 | Exceptional 96.7% |
| Swedes | 100.0 /100 | #5 | Exceptional 96.7% |
| Poles | 100.0 /100 | #6 | Exceptional 96.7% |
| Carpatho Rusyns | 100.0 /100 | #7 | Exceptional 96.7% |
| Germans | 100.0 /100 | #8 | Exceptional 96.7% |
| Tlingit-Haida | 100.0 /100 | #9 | Exceptional 96.6% |
| Lithuanians | 100.0 /100 | #10 | Exceptional 96.6% |
| Finns | 100.0 /100 | #11 | Exceptional 96.6% |
| English | 100.0 /100 | #12 | Exceptional 96.6% |
| Danes | 100.0 /100 | #13 | Exceptional 96.5% |
| Scottish | 100.0 /100 | #14 | Exceptional 96.5% |
| Irish | 100.0 /100 | #15 | Exceptional 96.5% |
| Croatians | 100.0 /100 | #16 | Exceptional 96.5% |
Demographics Similar to Creek by 9th Grade
In terms of 9th grade, the demographic groups most similar to Creek are Immigrants from Saudi Arabia (95.6%, a difference of 0.0%), Yugoslavian (95.7%, a difference of 0.010%), South African (95.6%, a difference of 0.010%), Immigrants from Germany (95.6%, a difference of 0.010%), and Immigrants from Latvia (95.6%, a difference of 0.010%).
| Demographics | Rating | Rank | 9th Grade |
| Immigrants | Denmark | 99.1 /100 | #84 | Exceptional 95.7% |
| Icelanders | 99.1 /100 | #85 | Exceptional 95.7% |
| Immigrants | Western Europe | 99.1 /100 | #86 | Exceptional 95.7% |
| Okinawans | 99.0 /100 | #87 | Exceptional 95.7% |
| Immigrants | Czechoslovakia | 98.9 /100 | #88 | Exceptional 95.7% |
| Yugoslavians | 98.9 /100 | #89 | Exceptional 95.7% |
| South Africans | 98.8 /100 | #90 | Exceptional 95.6% |
| Creek | 98.8 /100 | #91 | Exceptional 95.6% |
| Immigrants | Saudi Arabia | 98.8 /100 | #92 | Exceptional 95.6% |
| Immigrants | Germany | 98.7 /100 | #93 | Exceptional 95.6% |
| Immigrants | Latvia | 98.7 /100 | #94 | Exceptional 95.6% |
| Americans | 98.5 /100 | #95 | Exceptional 95.6% |
| Filipinos | 98.5 /100 | #96 | Exceptional 95.6% |
| Delaware | 98.4 /100 | #97 | Exceptional 95.6% |
| Immigrants | Japan | 98.4 /100 | #98 | Exceptional 95.6% |